US Dollar steadies as the Greenback not impressed by China’s stimulus plan
- The US Dollar trades steadily on Tuesday after Asian equity markets rallied on China’s stimulus plans.
- China wants to restart its economy with a 500 billion Yuan injection.
- The US Dollar Index consolidates in its September range near the yearly lows.
The US Dollar (USD) trades mixed on Tuesday after the Chinese government issued measures to reboot its sluggish economy. The main key elements of the plan are the 500 billion Yuan (CNY) cash injection and the liquidity line with the People’s Bank of China (PBoC) that allows funds and brokers to draw cash for buying stocks. This caused the Chinese Yuan (CNY) to rally nearly 0.50% against the Greenback during the Asian trading session on Tuesday.
On the economic data front, a relatively light calendar ahead with some second-tier data on Tuesday. The Richmond Fed Manufacturing Index for September might be the most market-moving, apart from the Federal Reserve Governor Michelle Bowman, who is expected to comment about the US economic outlook and monetary policy.
Daily digest market movers: Happy with where USD is
- On the geopolitical front, a United Nations emergency meeting is called on Tuesday for Lebanon after intense bombing over the weekend and on Monday by Israel.
- This Tuesday will kick off with Federal Reserve Governor Michelle Bowman, who delivers a speech about the US economic outlook and monetary policy at the Kentucky Bankers Association Annual Convention. Comments are expected to come in around 13:00 GMT.
- At that same time, the Housing Price Index for July is expected to be released. A positive 0.2% is expected after the small 0.1% contraction in June.
- At 14:00 GMT, the Richmond Fed Manufacturing Index for September is set to be released, expected to pick up a touch to -17 from -19 in August.
- At the same time, the Consumer Confidence reading is expected to come in at 104.0, better than the 103.3 previously.
- Equity markets are having a field day, with the Chinese Hang Seng and the Shanghai Shenzhen Index trading up over 4% at the close on Tuesday. European and US equities are following suit with smaller gains.
- The CME Fedwatch Tool shows a 48.5% chance of a 25-basis-point rate cut at the next Fed meeting on November 7, while 51.5% is pricing in another 50-basis-point rate cut.
- The US 10-year benchmark rate trades at 3.79%, flirting with a fresh September high.
US Dollar Index Technical Analysis: Something does not add up
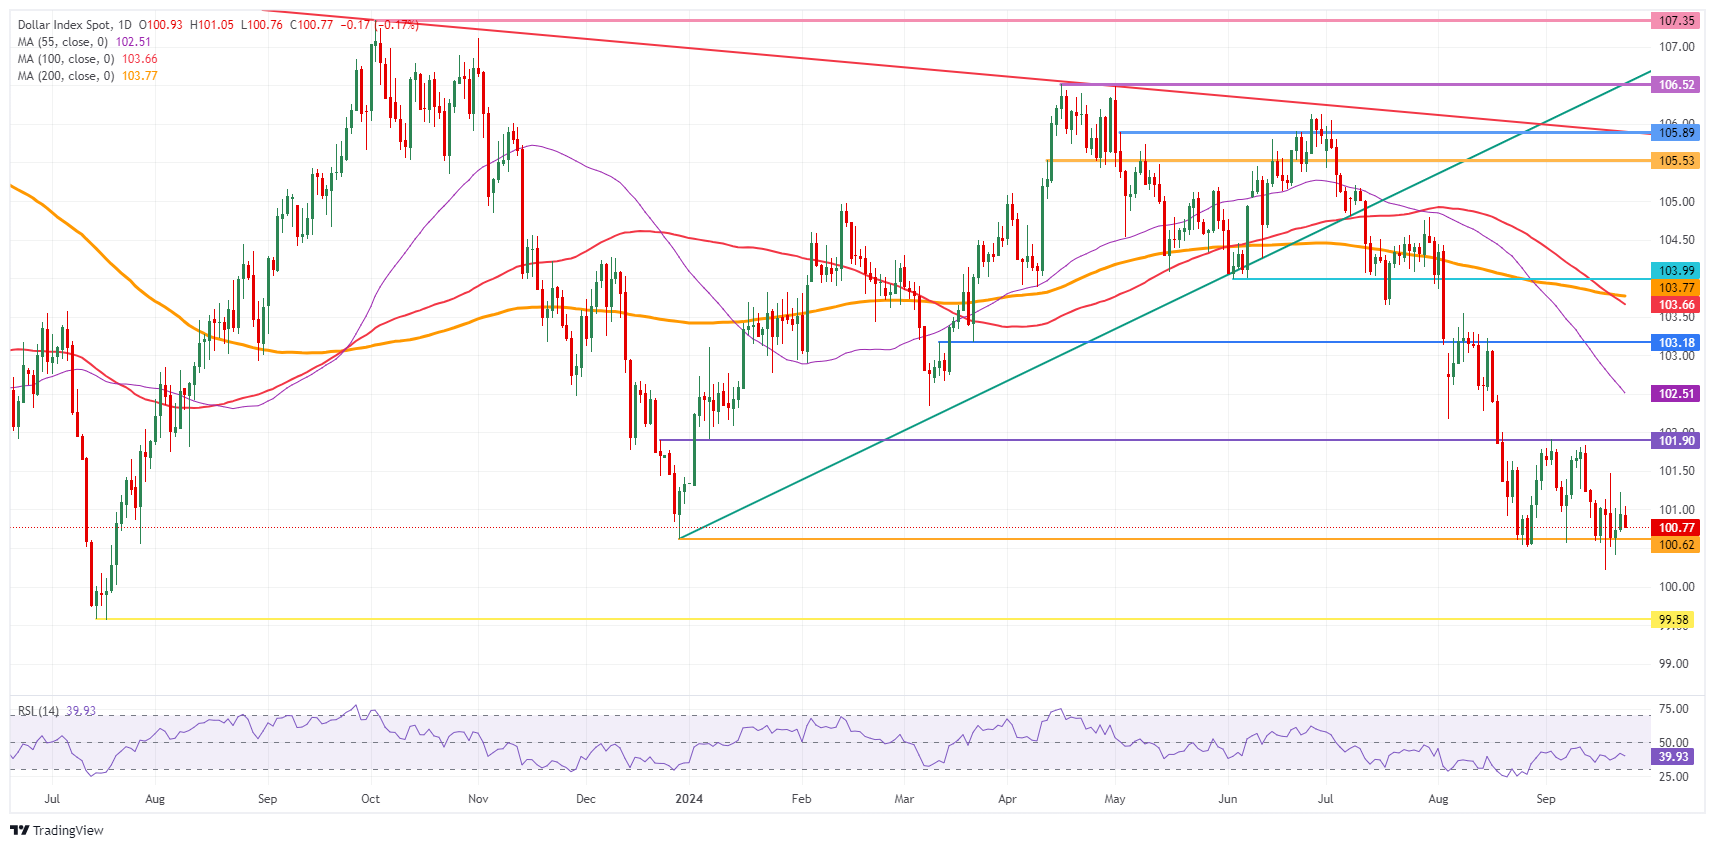
The US Dollar Index (DXY) looks a bit stuck, broken even, and locked in again in that September tight range near the yearly lows. When looking at the yields and the interest rate differentials between the US and other countries, it does not look to add up that the US Dollar is where it is at the moment. Traders are awaiting more data to assess where the US Dollar Index needs to go and commit to a certain trend.
The upper level of the September range remains at 101.90. Further up, the index could go to 103.18, with the 55-day Simple Moving Average (SMA) at 102.51 along the way. The next tranche up is very misty, with the 100-day SMA at 103.66 and the 200-day SMA at 103.77, just ahead of the big 104.00 round level.
On the downside, 100.62 (the low from December 28, 2023) is the first support, and a break could point to more weakness ahead. Should that take place, the low from July 14, 2023, at 99.58, will be the next level to look out for. If that level gives way, early levels from 2023 are coming in near 97.73.

US Dollar Index: Daily Chart
Risk sentiment FAQs
In the world of financial jargon the two widely used terms “risk-on” and “risk off'' refer to the level of risk that investors are willing to stomach during the period referenced. In a “risk-on” market, investors are optimistic about the future and more willing to buy risky assets. In a “risk-off” market investors start to ‘play it safe’ because they are worried about the future, and therefore buy less risky assets that are more certain of bringing a return, even if it is relatively modest.
Typically, during periods of “risk-on”, stock markets will rise, most commodities – except Gold – will also gain in value, since they benefit from a positive growth outlook. The currencies of nations that are heavy commodity exporters strengthen because of increased demand, and Cryptocurrencies rise. In a “risk-off” market, Bonds go up – especially major government Bonds – Gold shines, and safe-haven currencies such as the Japanese Yen, Swiss Franc and US Dollar all benefit.
The Australian Dollar (AUD), the Canadian Dollar (CAD), the New Zealand Dollar (NZD) and minor FX like the Ruble (RUB) and the South African Rand (ZAR), all tend to rise in markets that are “risk-on”. This is because the economies of these currencies are heavily reliant on commodity exports for growth, and commodities tend to rise in price during risk-on periods. This is because investors foresee greater demand for raw materials in the future due to heightened economic activity.
The major currencies that tend to rise during periods of “risk-off” are the US Dollar (USD), the Japanese Yen (JPY) and the Swiss Franc (CHF). The US Dollar, because it is the world’s reserve currency, and because in times of crisis investors buy US government debt, which is seen as safe because the largest economy in the world is unlikely to default. The Yen, from increased demand for Japanese government bonds, because a high proportion are held by domestic investors who are unlikely to dump them – even in a crisis. The Swiss Franc, because strict Swiss banking laws offer investors enhanced capital protection.

