US Dollar Index Price Forecast: Flashing signs the trend could be changing

Quelle Fxstreet
  • The US Dollar Index is flashing signs it could be changing trend and moving higher. 
  • The weekly and daily charts are showing bullish Japanese candlestick patterns after the recent touchdown on support at 100. 
  • The 4-hour chart is showing the formation of a possible new short-term uptrend. 

The US Dollar Index (DXY) has bounced off support at the floor of its multi-year range and formed some reversal patterns which indicate the possibility it may be reversing the bearish move down from the July highs. Overall, however, it is still a little too early to say for sure and there remains a risk bears could take hold of the reins again and push price back down. 

US Dollar Index Weekly Chart 
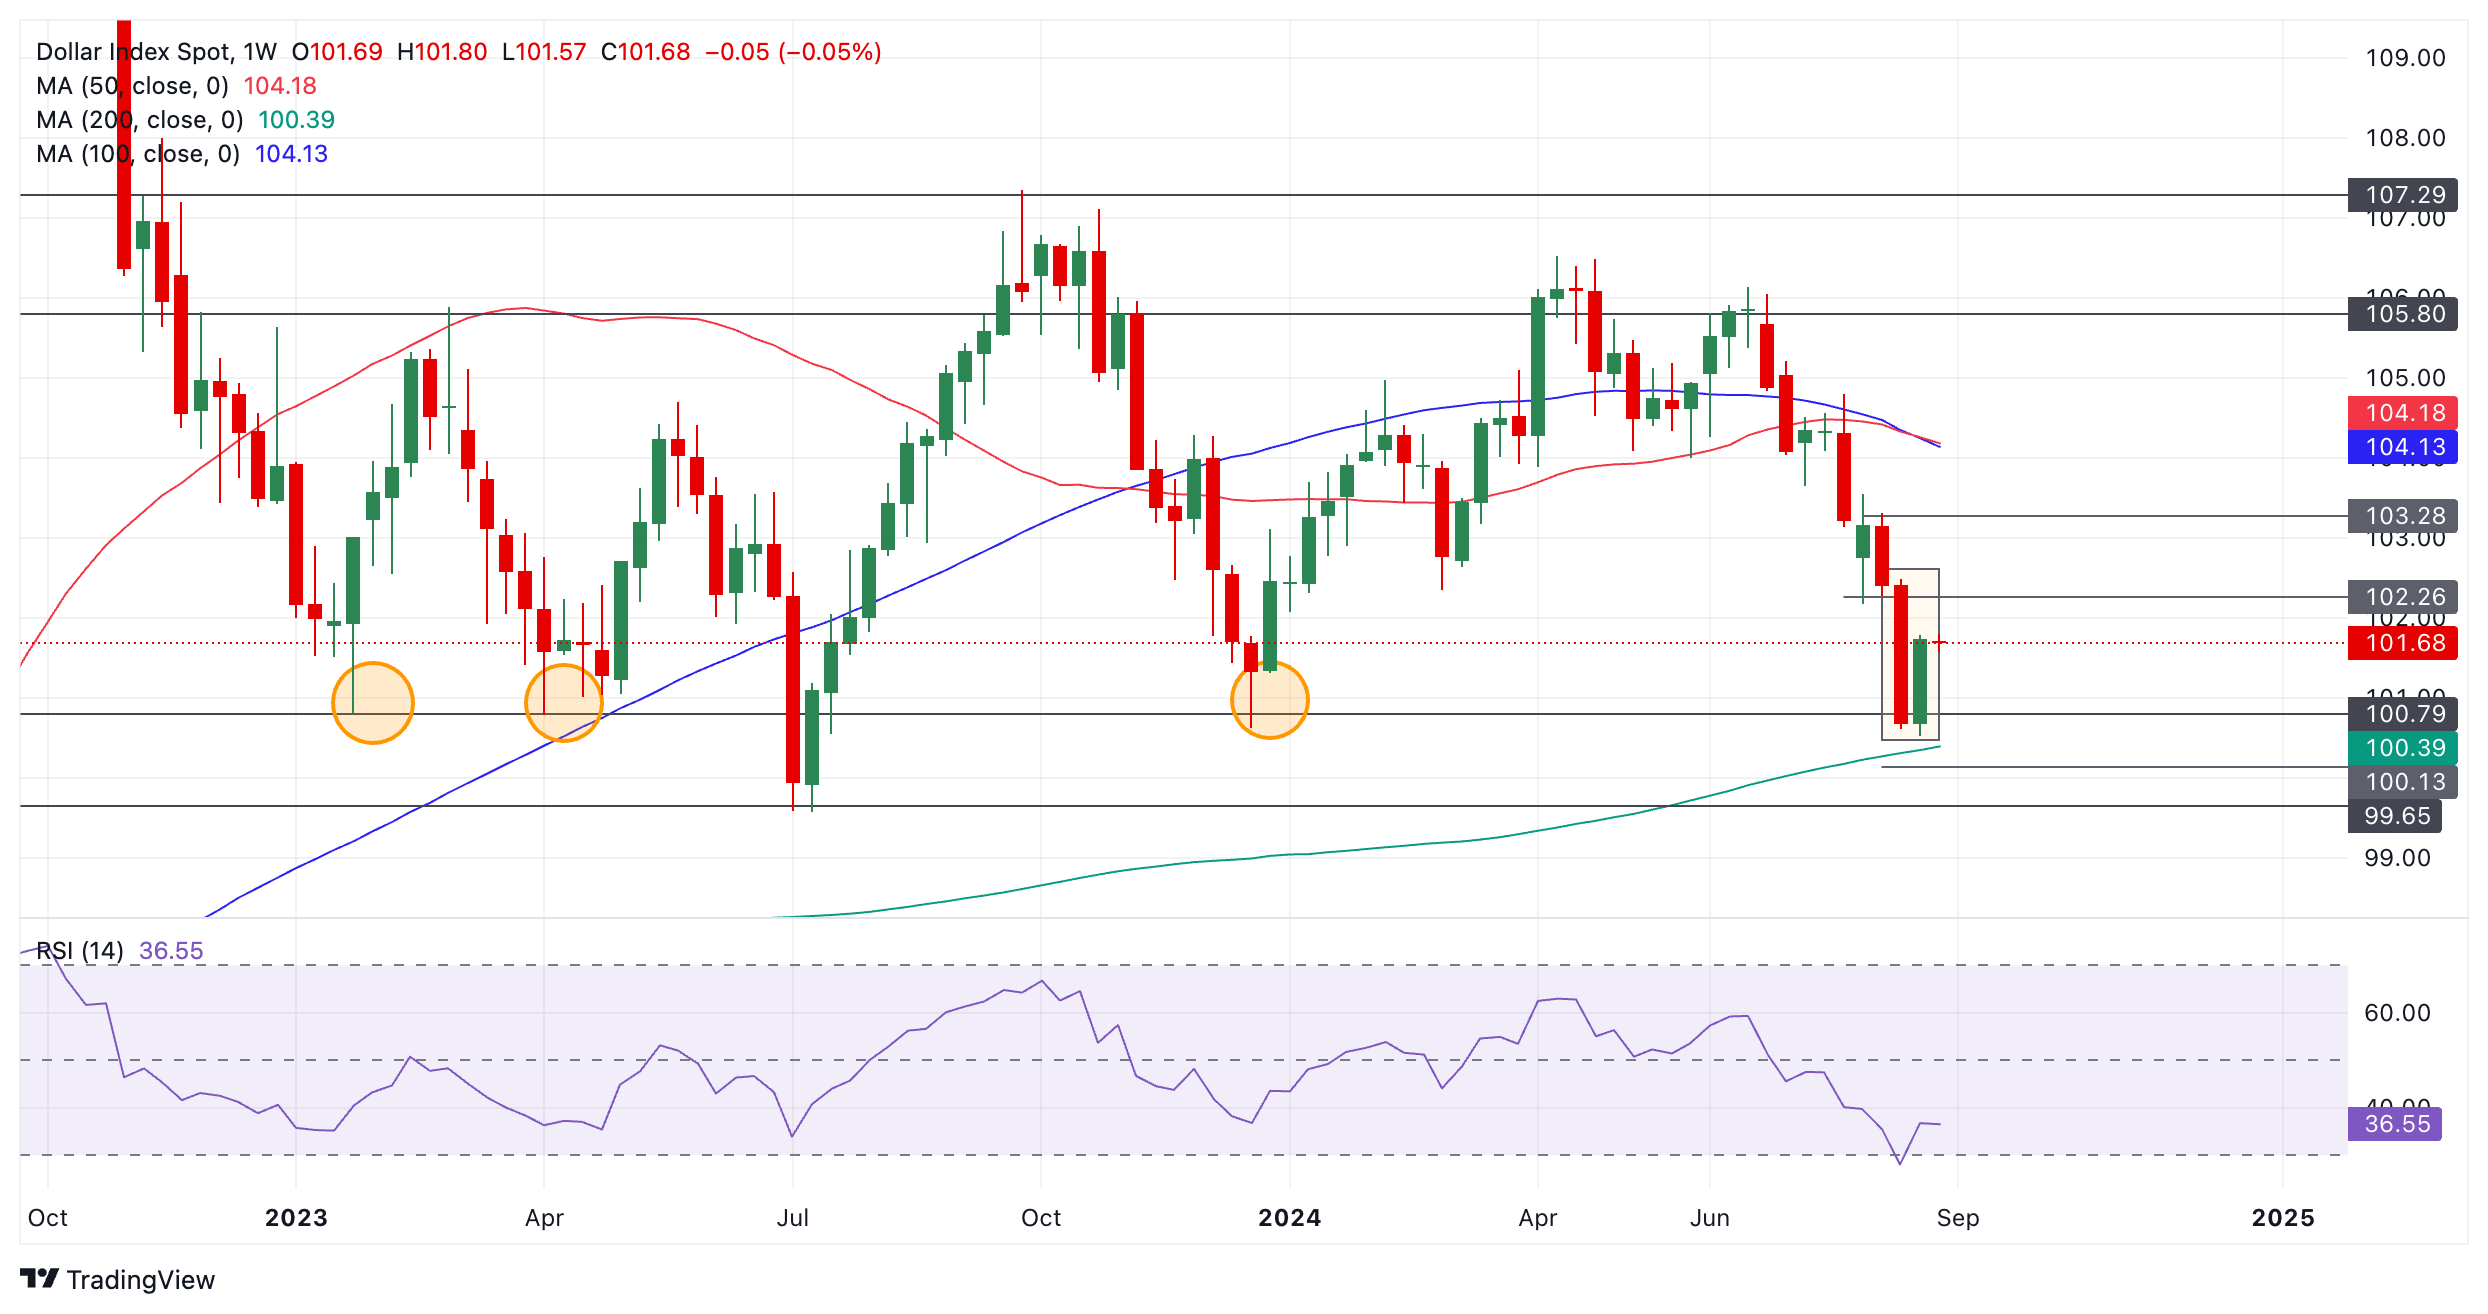


DXY has formed an unconfirmed bullish Piercing Line Japanese candlestick pattern (shaded rectangle) on the weekly chart at a historic support level in the 100s. This level has been tested multiple times in the past (orange bubbles). 

The Piercing Line pattern forms after a down move when a red candlestick is followed by a green candlestick that closes above the midpoint of the initial red candle. It is a sign of a bullish reversal. For confirmation, however, the pattern should be followed by another green candlestick which cannot be verified until the end of the current week. 

The Relative Strength Index (RSI) momentum indicator exited oversold last week providing a buy signal and adding further evidence to the possibility of a bullish recovery evolving. 

Dollar Index Daily Chart
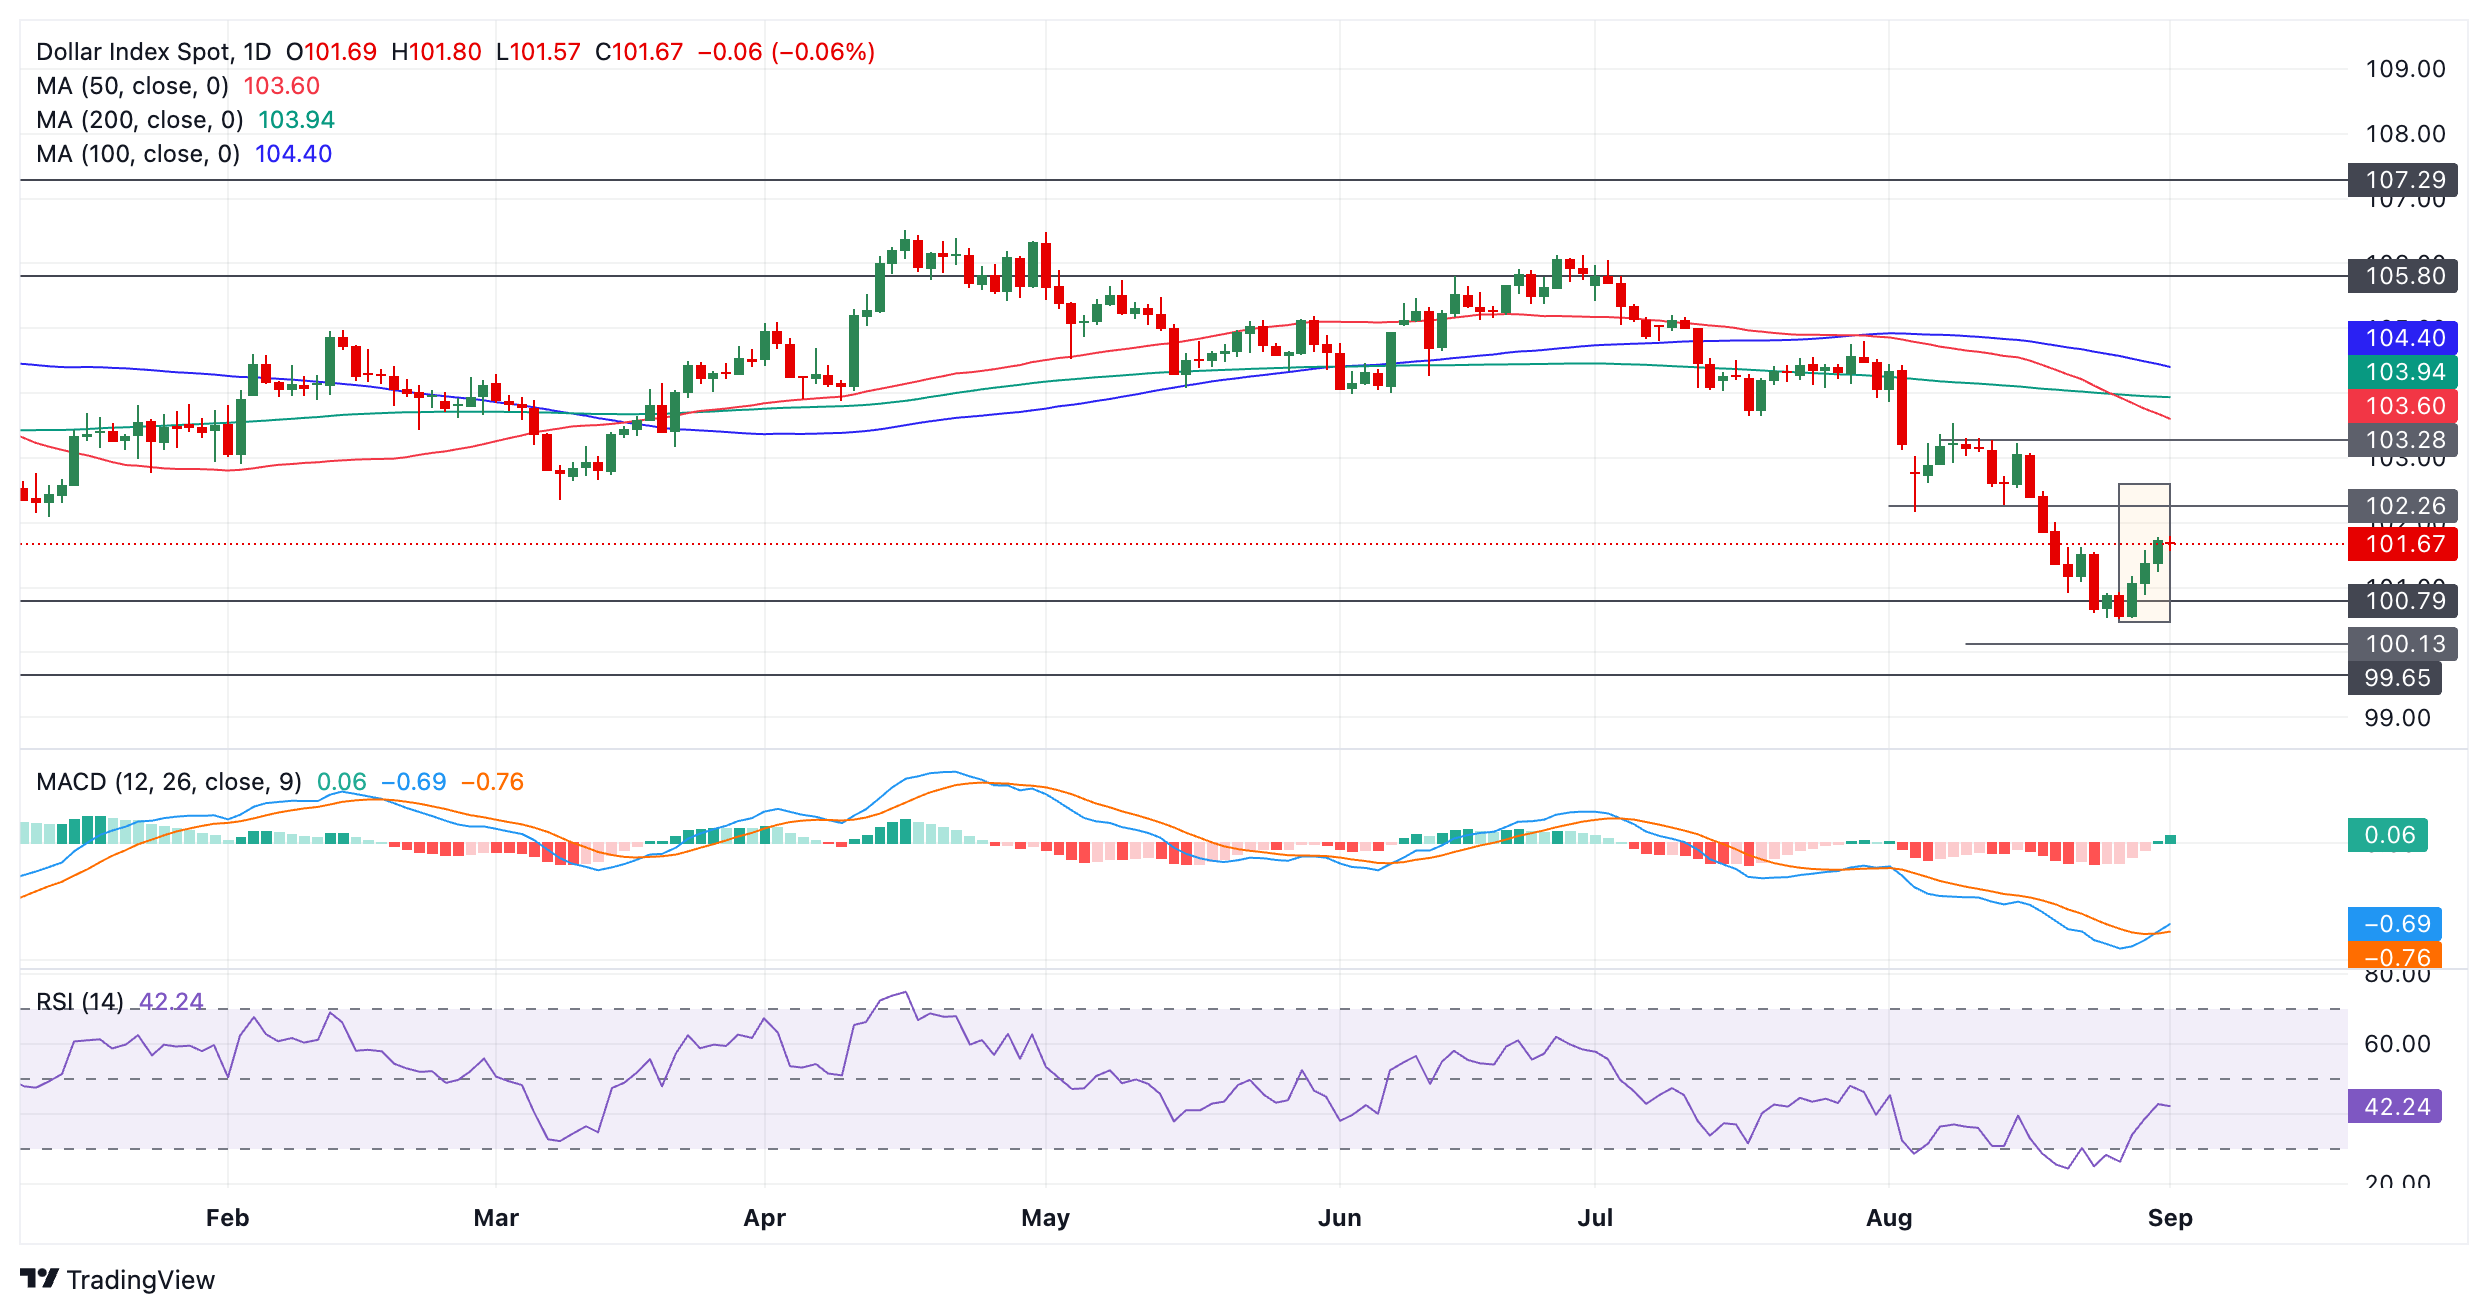
The DXY daily chart is showing that a Three White Soldiers Japanese candlestick pattern has formed during the recovery over the last three days. Such a pattern forms after a market bottom when three rising green candlesticks form in a row that are of a similar size. It is a bullish reversal sign. 

The Moving Average Convergence Divergence (MACD) momentum oscillator has crossed above its red signal line giving further evidence to the bullish hypothesis. 

The RSI also recently exited oversold, providing a buy signal. 

Dollar Index 4-hour Chart

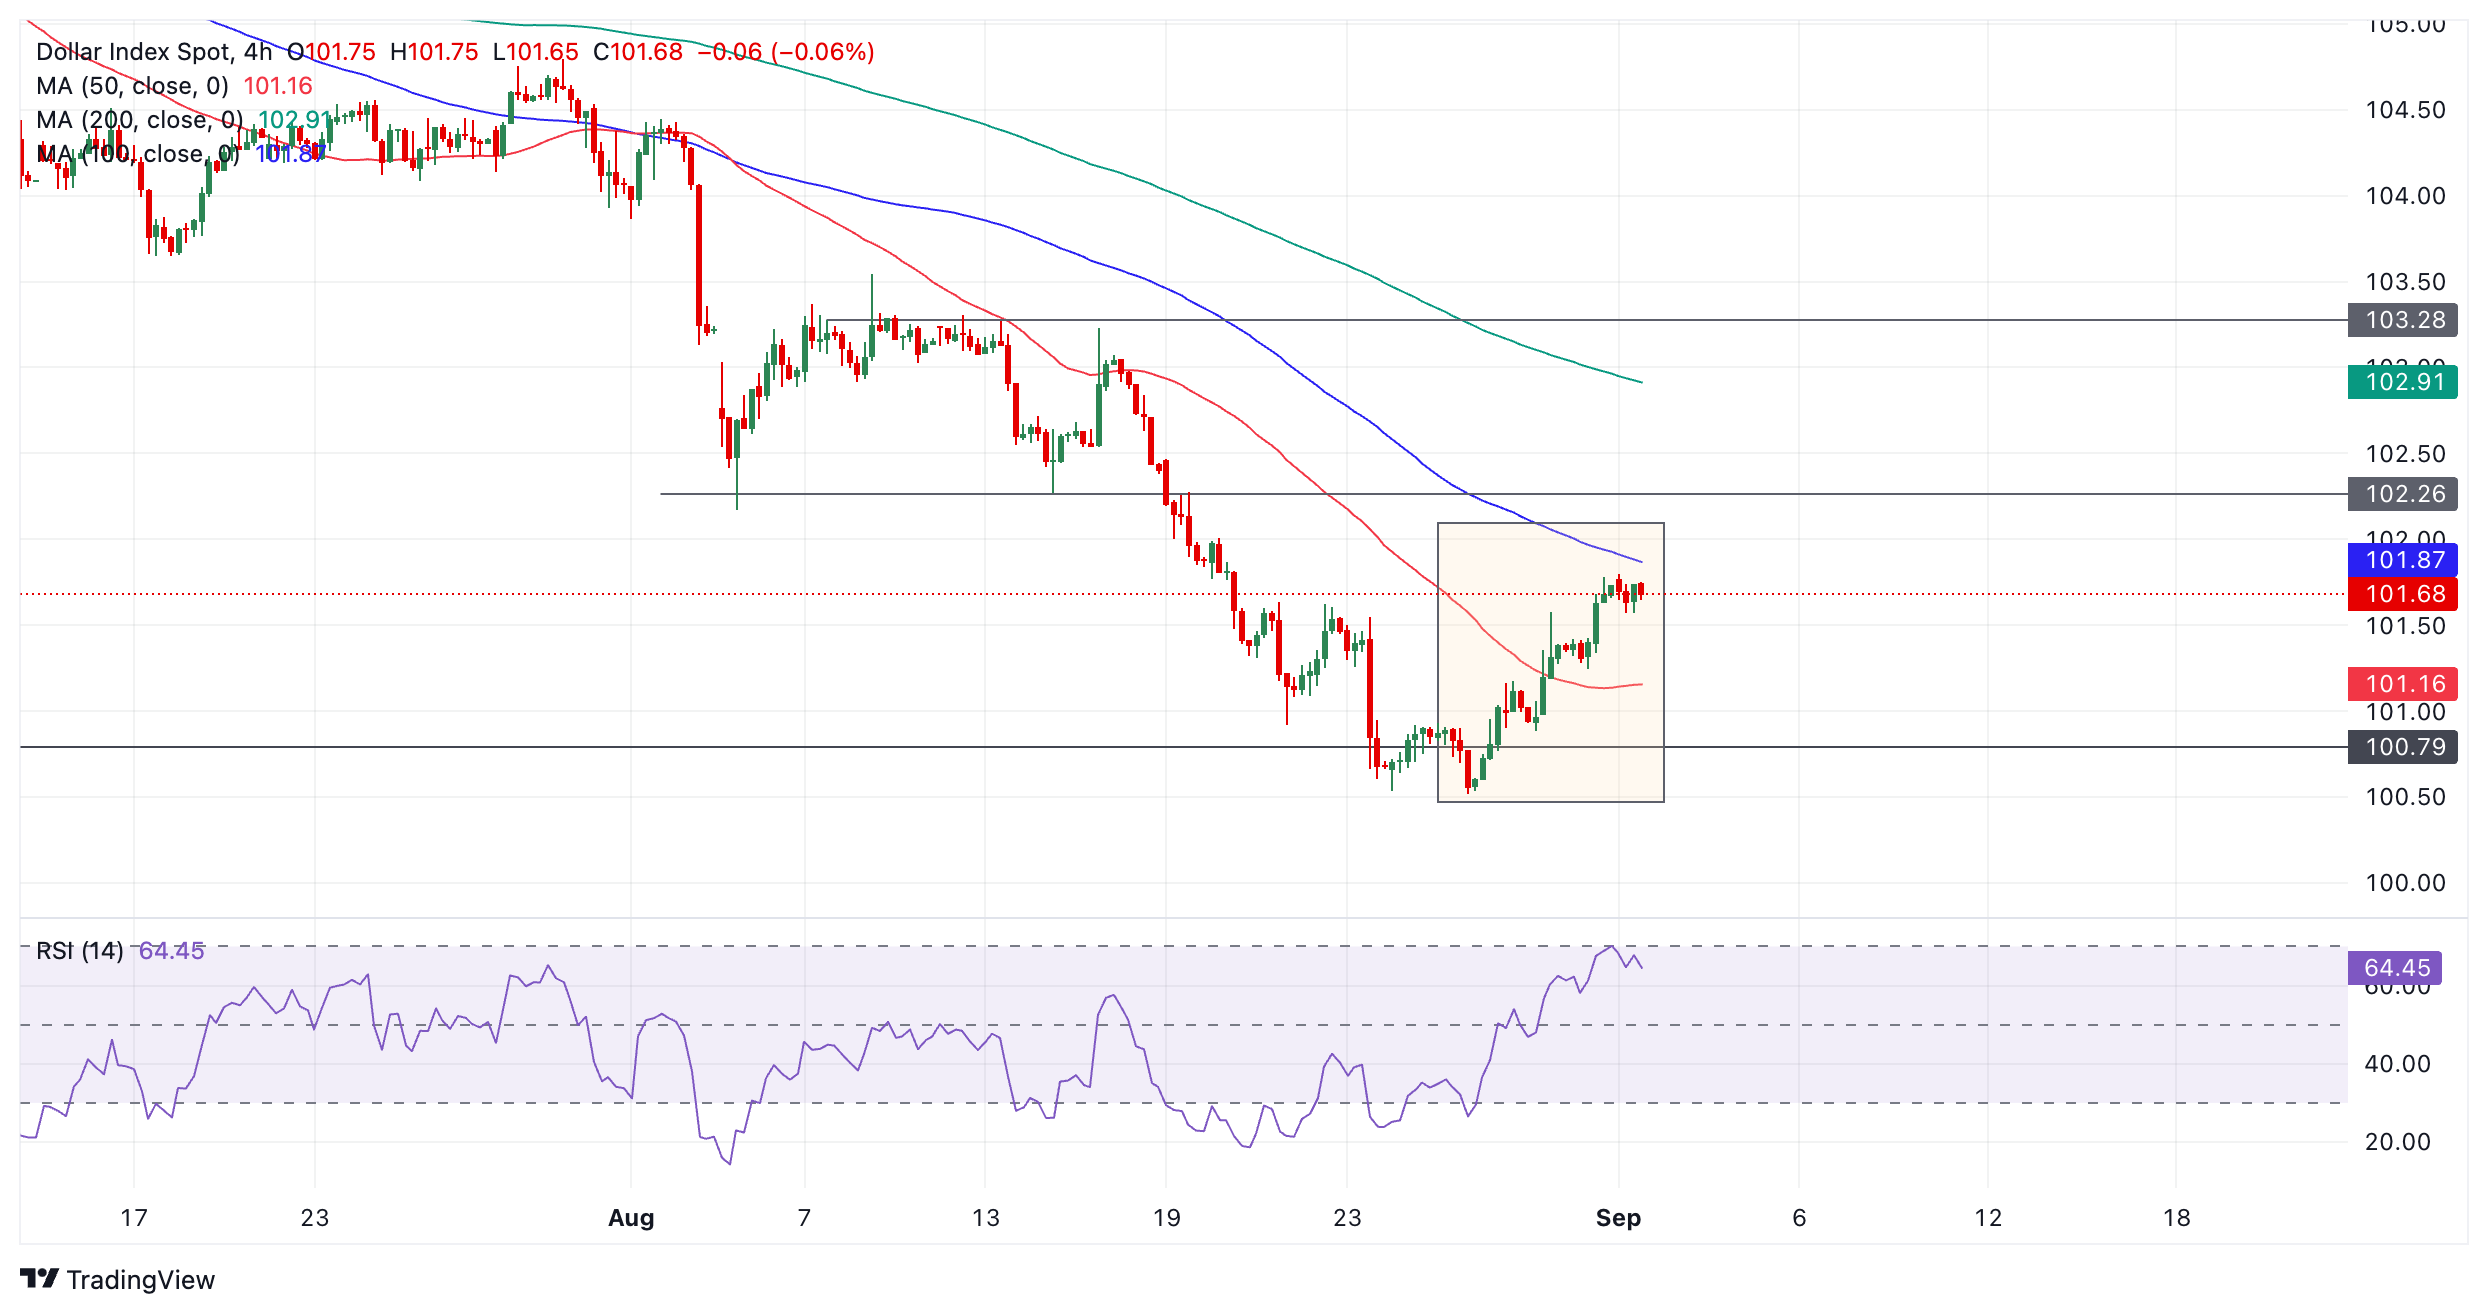
The 4-hour chart of DXY is showing the possible formation of a tender, new uptrend (shaded box). The sequence of peaks and troughs is now rising suggesting the short-term trend may be bullish. DXY has also broken above the key August 22 high. 

Given “the trend is your friend” this could indicate the evolution of higher highs, with the next target at the 102.26 level (August 14 low). 

The RSI has just exited overbought, however, raising the risk of a deeper pull back evolving. 


Haftungsausschluss: Nur zu Informationszwecken. Die bisherige Performance ist kein verlässlicher Indikator für zukünftige Ergebnisse.
placeholder
Boeing-Beschäftigte treten in Streik – 30.000 fordern höhere LöhneInvesting.com - Rund 30.000 Mitarbeiterinnen und Mitarbeiter von Boeing (NYSE:BA) legen ab heute ihre Arbeit nieder. Die Abstimmung über den Streik fiel mit überwältigender Mehrheit aus: 96 % der Bele
Autor  Investing.com
vor 13 Stunden
Investing.com - Rund 30.000 Mitarbeiterinnen und Mitarbeiter von Boeing (NYSE:BA) legen ab heute ihre Arbeit nieder. Die Abstimmung über den Streik fiel mit überwältigender Mehrheit aus: 96 % der Bele
placeholder
Bitcoin-Rallye auf 65.000 US-Dollar wahrscheinlich, wenn BTC diese Hürden überwindetBitcoin (BTC) Spot-ETFs gelten als Indikator für das institutionelle Interesse an der Anlageklasse.
Autor  FXStreet
Sa. 14.Sep
Bitcoin (BTC) Spot-ETFs gelten als Indikator für das institutionelle Interesse an der Anlageklasse.
placeholder
Der EUR/USD scheitert beim Versuch, die Marke von 1,11 zurückzuerobern, und schließt am Freitag unverändertDer EUR/USD stieg am Freitag kurzzeitig wieder über die Marke von 1,1100, bevor Markteinflüsse den Euro erneut belasteten und den Kurs auf das Eröffnungsniveau zurückfallen ließen.
Autor  FXStreet
Sa. 14.Sep
Der EUR/USD stieg am Freitag kurzzeitig wieder über die Marke von 1,1100, bevor Markteinflüsse den Euro erneut belasteten und den Kurs auf das Eröffnungsniveau zurückfallen ließen.
placeholder
Worldcoin fällt, während die World ID auf das Solana-Netzwerk überführt wirdWorldcoin (WLD) gab am Freitag in einer Pressemitteilung bekannt, dass die Wormhole Foundation die World ID-Lösung erfolgreich auf das Solana-Netzwerk übertragen hat.
Autor  FXStreet
Sa. 14.Sep
Worldcoin (WLD) gab am Freitag in einer Pressemitteilung bekannt, dass die Wormhole Foundation die World ID-Lösung erfolgreich auf das Solana-Netzwerk übertragen hat.
placeholder
Arbitrum und APE führen nächste Woche Token-Freischaltungen im Wert von 113 Millionen US-Dollar anDer Kryptomarkt wird in der nächsten Woche eine Angebotserhöhung von 113,02 Millionen US-Dollar erleben, da Projekte wie Arbitrum (ARB), Apecoin (APE), Echelon Prime (PRIME) und Ethena (ENA) Cliff-Unlocks durchführen werden.
Autor  FXStreet
Sa. 14.Sep
Der Kryptomarkt wird in der nächsten Woche eine Angebotserhöhung von 113,02 Millionen US-Dollar erleben, da Projekte wie Arbitrum (ARB), Apecoin (APE), Echelon Prime (PRIME) und Ethena (ENA) Cliff-Unlocks durchführen werden.
verbundene Finanzinstrumente
goTop
quote