Bitcoin extends correction below the $60,000 level

Quelle Fxstreet
  • Bitcoin corrects on Monday, down nearly 1% as it settles back under the $60,000 level.
  • Crypto Fear and Greed Index flashes “fear” as Bitcoin erases recent gains.
  • Bitcoin traders continue to take profits, with nearly $720 million in profits realized in the last six days.

Bitcoin (BTC) extends correction and erases Friday’s gains after being unable to hold above the psychologically important $60,000 level over the weekend. Since Saturday’s opening, BTC erased nearly 3% of its value and trades near $58,500 at the time of writing on Monday. 

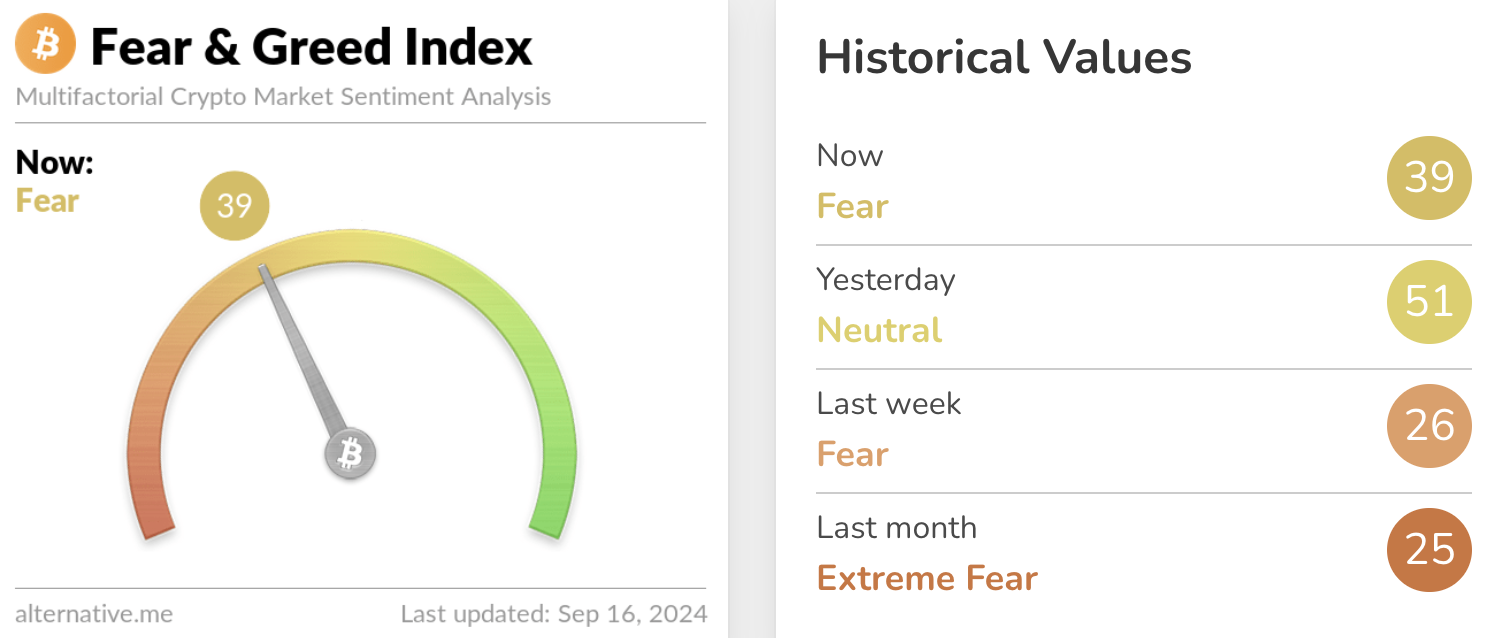
The crypto Fear and Greed Index, which measures the sentiment among market participants on a scale of 0 to 100, shows “fear” among traders. 

Bitcoin loses value over the weekend and Monday

Bitcoin, the largest cryptocurrency by market capitalization, has been correcting since the weekend. BTC suffered a drop after being unable to hold above the psychological level of $60,000. 

The Crypto Fear and Greed Index turned neutral when Bitcoin made a comeback above $60,000 on Friday. Since the asset’s dip below the key level over the weekend, the Index is back at “fear” levels. This shows the importance of the $60,000 price level for the asset’s traders. 
BTC

Bitcoin Fear & Greed Index 

Data from crypto intelligence tracker Santiment shows that Bitcoin traders have consistently taken profits, nearly $720 million in realized gains between September 10 and 16, at the time of writing, as measured by the Network Realized Profit/Loss metric (NPL), which tracks the net realized profit/loss of all tokens traded in a day. 

Large-scale profit-taking could push prices lower since it increases selling pressure on BTC. 

BTC

Bitcoin price and NPL 

Where is Bitcoin headed?

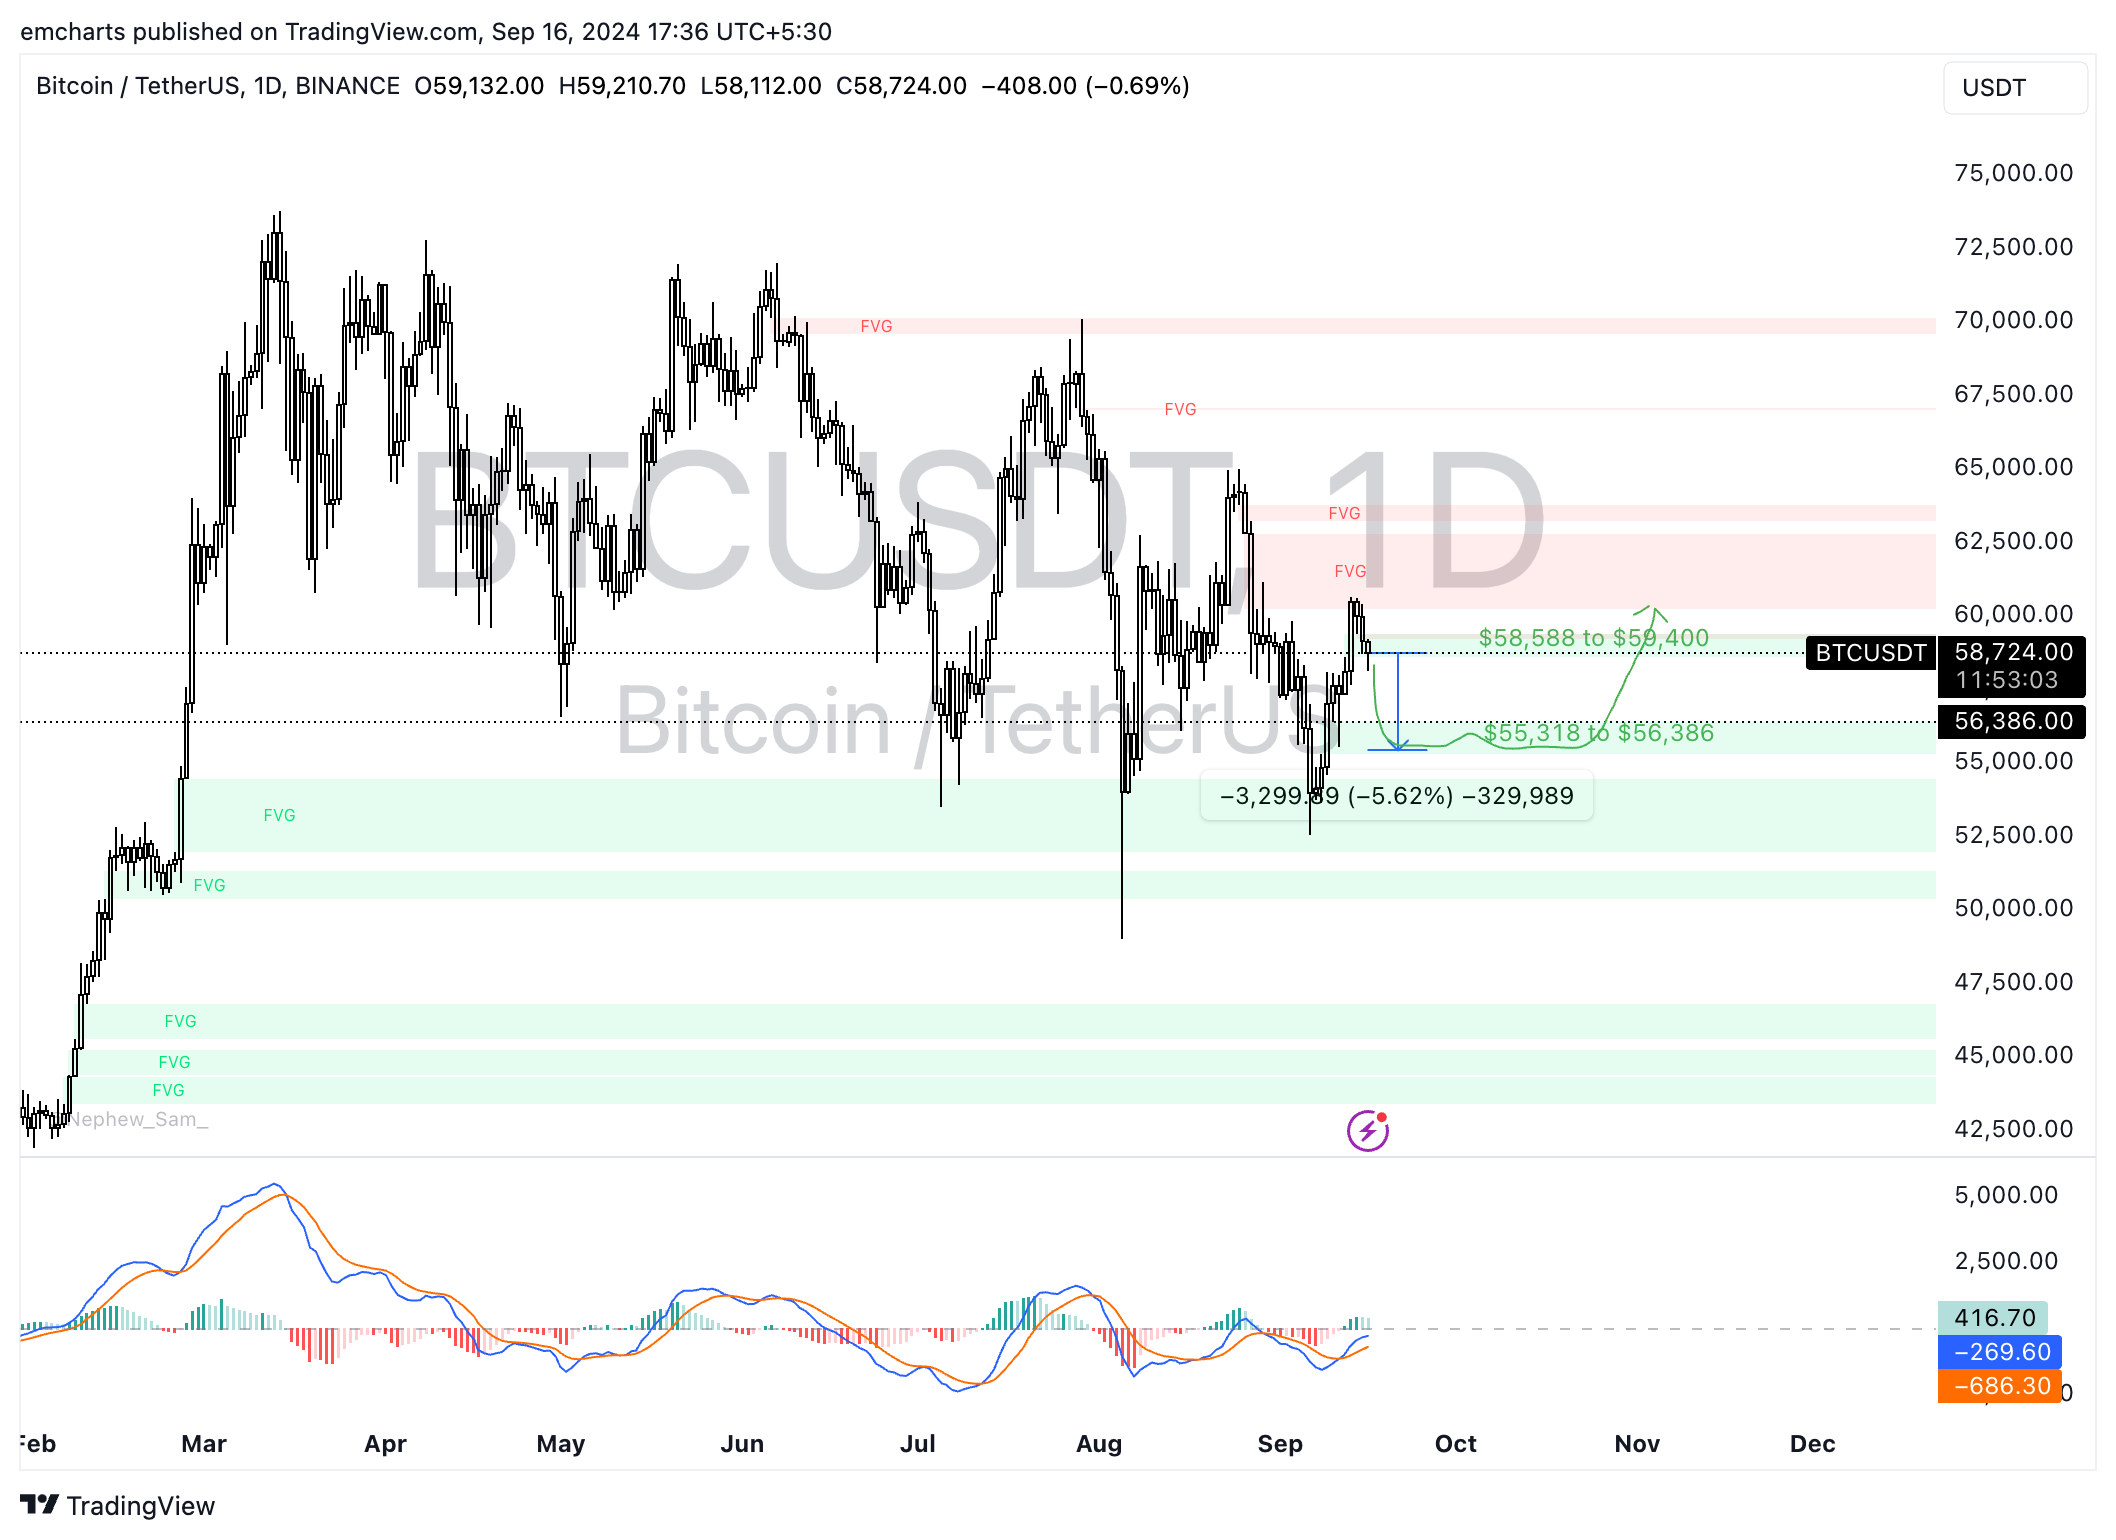
Bitcoin could extend losses and sweep liquidity at the lower boundary of the Fair Value Gap (FVG) between $55,318 and $56,386. From the current level, BTC could erase nearly 6% of its value to reach the target of $55,318, the September 8 high. 

The Relative Strength Index (RSI), a momentum indicator, hovers above 50 on the daily timeframe at 50.40. RSI at 50 marks the neutral level, meaning Bitcoin is neither overbought nor oversold and signalling a lack of directional momentum. 

The Moving Average Convergence Divergence (MACD) indicator shows green histogram bars above the neutral line, signaling underlying positive momentum in Bitcoin’s price trend. Bitcoin could try a recovery once it sweeps liquidity in the imbalance zone and attempts a rally to the $60,000 level, a psychological barrier. 
Bitcoin

BTC/USDT daily chart

Looking down, BTC could find support at the September 6 low of $52,550, this marks the lowest level for Bitcoin this month. 

Haftungsausschluss: Nur zu Informationszwecken. Die bisherige Performance ist kein verlässlicher Indikator für zukünftige Ergebnisse.
placeholder
Gold erreicht Zwei-Wochen-Hoch; zielt auf 4.200 $ während dovishe Fed USD-Anstieg und Risikobereitschaft ausgleichtGold zieht am Freitag während der asiatischen Sitzung frische Käufer an und klettert auf ein Zwei-Wochen-Hoch, während die Bullen nun darauf abzielen, die Marke von 4.200 USD zurückzuerobern, angesichts dovisher Erwartungen an die US-Notenbank (Fed)
Autor  FXStreet
vor 13 Stunden
Gold zieht am Freitag während der asiatischen Sitzung frische Käufer an und klettert auf ein Zwei-Wochen-Hoch, während die Bullen nun darauf abzielen, die Marke von 4.200 USD zurückzuerobern, angesichts dovisher Erwartungen an die US-Notenbank (Fed)
placeholder
Pi Network Preisprognose: PI fällt, da die Token-Freigabe im Dezember die Gaming-Partnerschaft überschattetDas Pi Network (PI) ist zum Zeitpunkt der Pressemitteilung am Freitag um 4% gefallen, nachdem es drei Tage lang einen Aufwärtstrend gab, der durch die Ankündigung der Partnerschaft mit CiDi Games am Mittwoch angeheizt wurde
Autor  FXStreet
vor 13 Stunden
Das Pi Network (PI) ist zum Zeitpunkt der Pressemitteilung am Freitag um 4% gefallen, nachdem es drei Tage lang einen Aufwärtstrend gab, der durch die Ankündigung der Partnerschaft mit CiDi Games am Mittwoch angeheizt wurde
placeholder
Zcash-Analyse: Überhitzung durch Kleinanleger – droht ein 30-Prozent-Absturz?Der Artikel zeigt, wie stagnierende Shielded-Pools, überhitztes Retail-Volumen und ein kritischer Test des 50-Tage-EMA bei 436 US-Dollar das Risiko eines über 30%igen Rückgangs bei Zcash erhöhen – und welche Marken für einen möglichen Rebound bis 600 bzw. 750 US-Dollar entscheidend sind.
Autor  Mitrade Team
vor 14 Stunden
Der Artikel zeigt, wie stagnierende Shielded-Pools, überhitztes Retail-Volumen und ein kritischer Test des 50-Tage-EMA bei 436 US-Dollar das Risiko eines über 30%igen Rückgangs bei Zcash erhöhen – und welche Marken für einen möglichen Rebound bis 600 bzw. 750 US-Dollar entscheidend sind.
placeholder
Bullen beißen sich an der 54,50-Dollar-Marke die Zähne ausDer Artikel analysiert, wie Silber nach einem Ein-Monats-Hoch ein mögliches Mehrfach-Top nahe 54,50 US-Dollar ausbildet, warum Rücksetzer in Richtung 53,00 und 52,70–52,65 US-Dollar vorerst als Kaufchance gelten und welche Widerstandsmarken zwischen 54,20 und 55,00 US-Dollar für eine Fortsetzung der Rally entscheidend sind.
Autor  Mitrade Team
vor 14 Stunden
Der Artikel analysiert, wie Silber nach einem Ein-Monats-Hoch ein mögliches Mehrfach-Top nahe 54,50 US-Dollar ausbildet, warum Rücksetzer in Richtung 53,00 und 52,70–52,65 US-Dollar vorerst als Kaufchance gelten und welche Widerstandsmarken zwischen 54,20 und 55,00 US-Dollar für eine Fortsetzung der Rally entscheidend sind.
placeholder
4.200 Dollar im Fadenkreuz – Zinsfantasie entfacht neue KaufwuchtDer Artikel analysiert den Anstieg des Goldpreises auf ein Zwei-Wochen-Hoch, die Rolle dovisher Fed-Erwartungen und geopolitischer Risiken sowie die zentralen Unterstützungs- und Widerstandsmarken rund um 4.170, 4.200 und 4.050–4.040 US-Dollar für die weitere Entwicklung von XAU/USD.
Autor  Mitrade Team
vor 14 Stunden
Der Artikel analysiert den Anstieg des Goldpreises auf ein Zwei-Wochen-Hoch, die Rolle dovisher Fed-Erwartungen und geopolitischer Risiken sowie die zentralen Unterstützungs- und Widerstandsmarken rund um 4.170, 4.200 und 4.050–4.040 US-Dollar für die weitere Entwicklung von XAU/USD.
verbundene Finanzinstrumente
goTop
quote