Ripple analyst sets double-digit target by 2025 for XRP while traders await SEC vs. Ripple lawsuit ruling
- Ripple could see the end of its lawsuit with the Securities and Exchange Commission soon, per recent reports.
- An analyst predicts XRP rally to $17 through the Bent Fork chart, a bullish thesis for the altcoin.
- XRP traders at $0.44 on Wednesday, adding nearly 2% value on the day.
Ripple (XRP) traders are awaiting the final ruling in the US Securities and Exchange Commission (SEC) lawsuit against the payment remittance firm. A pro-crypto attorney, Fred Rispoli, informed market participants that a ruling is likely by July 31 2024, through a tweet on X.
XRP traders are awaiting the ruling, a key market mover for the altcoin, in July 2024.
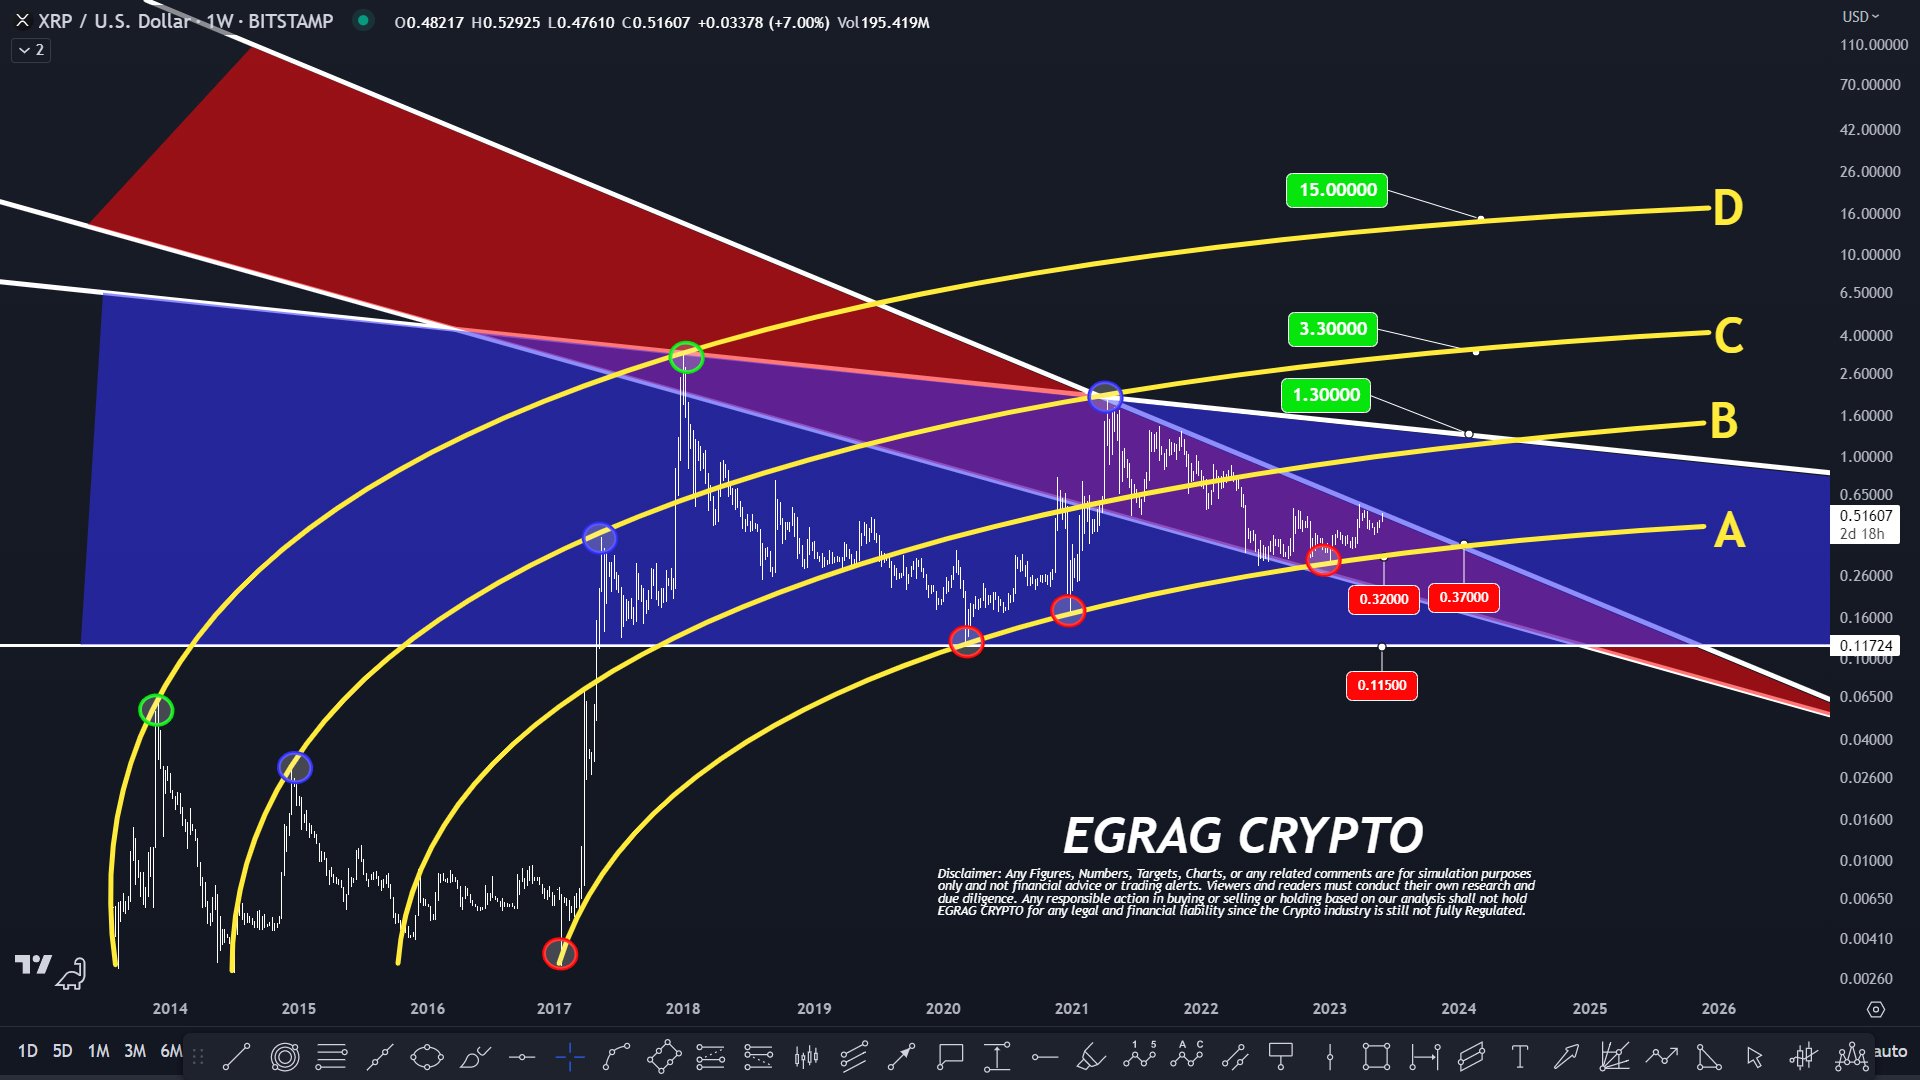
Additionally, a crypto analyst behind the X handle @egragcrypto has analyzed XRP price trend and set a $17 target for 2025. While XRP trades at $0.44 on Wednesday, July 10, the analyst presents a Bent Fork chart as a thesis backing his prediction for the altcoin.
Daily digest market movers: Ripple traders await ruling in lawsuit, RLUSD launch
- The SEC alleges that Ripple sold unregistered securities (XRP tokens) to institutional investors and asked the court for over $2 billion in penalties. In a development in May 2024, the SEC quoted $102.6 million.
- Ripple filed a letter of supplemental authority, citing the Binance lawsuit, where Judge Analisa Torres’ ruling was considered as precedent. The ruling of Judge Amy Berman Jackson cemented the status of XRP as not a security in secondary market sales, meaning sales on exchange platforms.
- SEC filed its response to the supplemental authority letter. With both filings in, Ripple traders are awaiting a ruling in the lawsuit.
- Pro-crypto attorney Fred Rispoli says the ruling is expected as early as Saturday, July 13, or by July 31, 2024.
- The lawsuit has been a key market mover for the altcoin since the legal battle commenced.
- Alongside lawsuit developments, on-chain metrics have influenced XRP traders’ sentiment and the asset’s price in the past.
- Santiment data shows a large spike in active addresses in XRP on July 10; over 27,000 addresses were active on the XRP Ledger. This supports a bullish thesis for the altcoin, signaling rising demand and relevance among market participants.
 [18.06.04, 10 Jul, 2024]-638562148743802210.png)
XRP Active addresses and price
- After consistently realizing losses on their XRP holdings since May 30, traders realized $4.42 million in gains on July 10. The long period of negative spikes on the Network Realized Profit/Loss metric is consistent with capitulation among investors.
 [18.07.38, 10 Jul, 2024]-638562149070142047.png)
XRP Network realized profit/loss
Technical analysis: XRP analyst predicts rally to $17 by 2025, altcoin extends gains
Analyst behind the X handle @egragcrypto has predicted a $17 target for XRP by 2025 based on his Bent Fork chart. This is a long-term target for the altcoin that currently trades at $0.44 on Binance.
The analyst introduced the chart with key resistances at $1, a psychological hurdle, and $3.5, the asset’s all-time high. The analyst introduced the target for the first time in 2023 with four tracks,
A) Major Historical Support
B) Ranging Zone
C) Mid-Cycle Top
D) Cycle Top
The analyst considers the track D is the one that the altcoin is most likely to reach, with a slight variation. The target has been increased from $15 in 2023 to $17 in the latest update.

XRP/USD chart
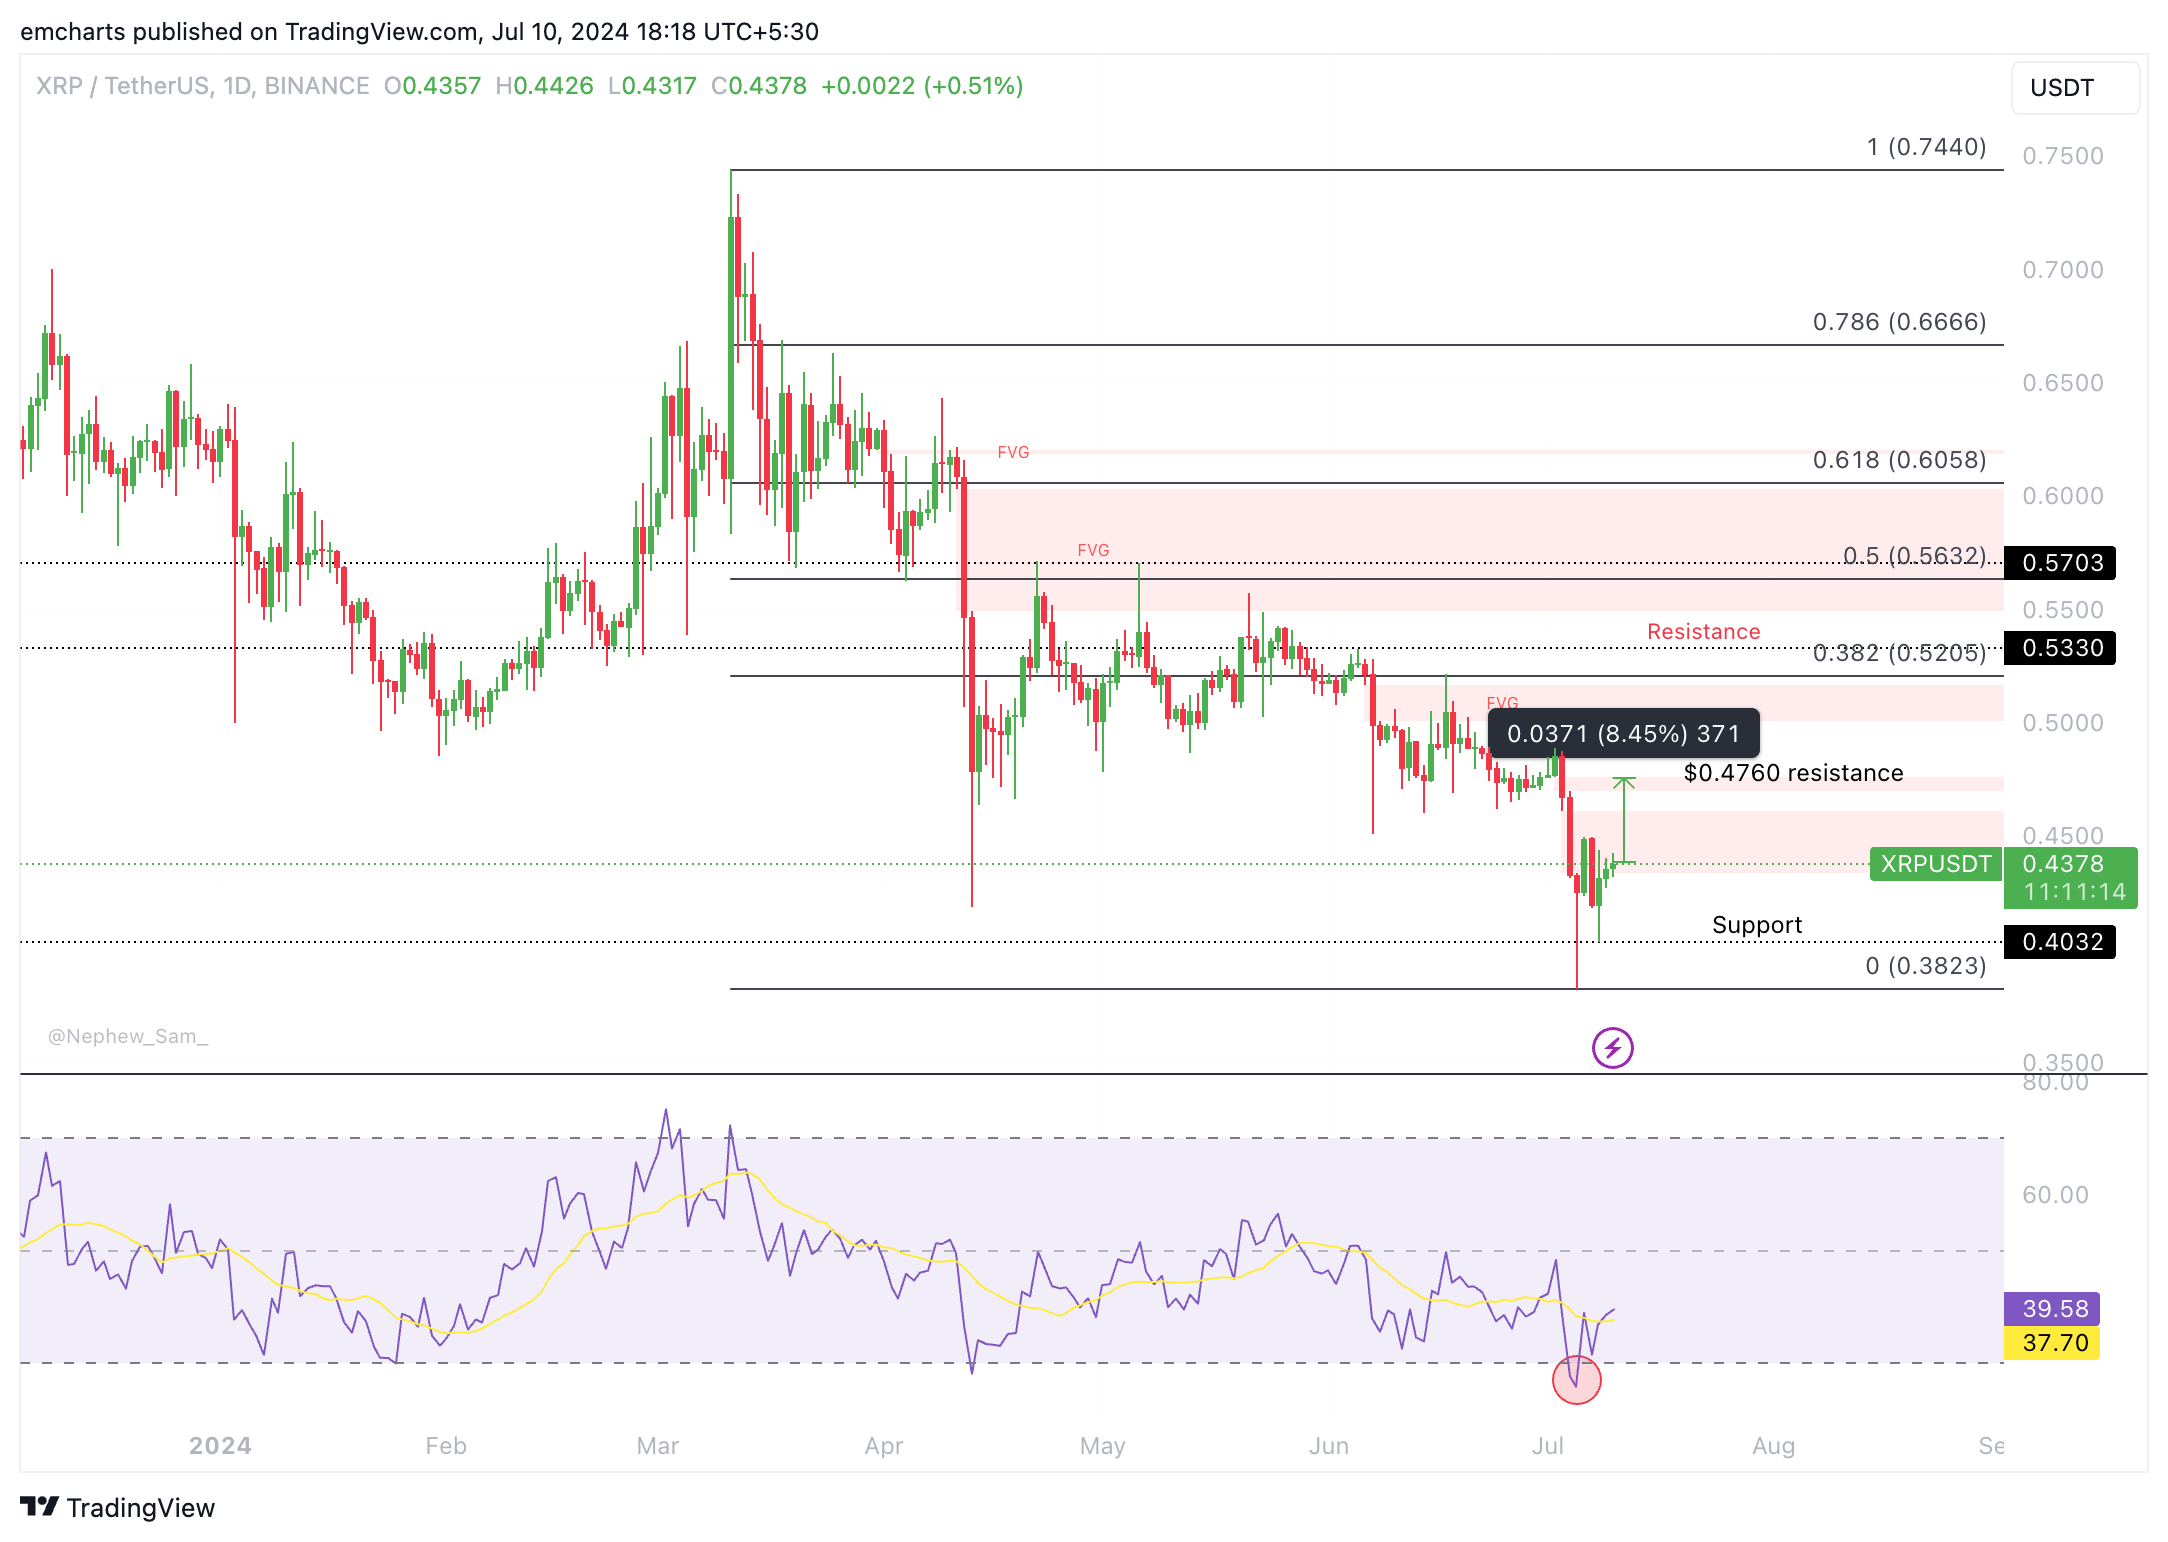
On the XRP/USDT daily chart, it is clear that XRP is recovering from its recent downward correction. If Ripple extends its gains, the altcoin could add 8.45% to its value and hit resistance at $0.4760, the July 2 low and the upper boundary of the Fair Value Gap (FVG), as seen in the chart below.
The Relative Strength Index (RSI) reads 39.58, showing Ripple’s price trend has underlying positive momentum.

XRP/USDT daily chart
Ripple could find support at $0.4032, the July 8 low. In the event of further correction, XRP could sweep liquidity at the July 5 low of $0.3823.
Cryptocurrency metrics FAQs
The developer or creator of each cryptocurrency decides on the total number of tokens that can be minted or issued. Only a certain number of these assets can be minted by mining, staking or other mechanisms. This is defined by the algorithm of the underlying blockchain technology. Since its inception, a total of 19,445,656 BTCs have been mined, which is the circulating supply of Bitcoin. On the other hand, circulating supply can also be decreased via actions such as burning tokens, or mistakenly sending assets to addresses of other incompatible blockchains.
Market capitalization is the result of multiplying the circulating supply of a certain asset by the asset’s current market value. For Bitcoin, the market capitalization at the beginning of August 2023 is above $570 billion, which is the result of the more than 19 million BTC in circulation multiplied by the Bitcoin price around $29,600.
Trading volume refers to the total number of tokens for a specific asset that has been transacted or exchanged between buyers and sellers within set trading hours, for example, 24 hours. It is used to gauge market sentiment, this metric combines all volumes on centralized exchanges and decentralized exchanges. Increasing trading volume often denotes the demand for a certain asset as more people are buying and selling the cryptocurrency.
Funding rates are a concept designed to encourage traders to take positions and ensure perpetual contract prices match spot markets. It defines a mechanism by exchanges to ensure that future prices and index prices periodic payments regularly converge. When the funding rate is positive, the price of the perpetual contract is higher than the mark price. This means traders who are bullish and have opened long positions pay traders who are in short positions. On the other hand, a negative funding rate means perpetual prices are below the mark price, and hence traders with short positions pay traders who have opened long positions.

