

Crude Oil consolidates around at $710 as after rally halts
- Crude Oil popped higher on Thursday after intense attacks from Israel on Lebanon.
- Saudi Arabia has cut its crude oil exports in July to an almost one-year low.
- The US Dollar Index remains under pressure, trading near the yearly lows.
Crude Oil consolidates at around $71 on Friday after popping higher by nearly 3% the previous day as a peace or ceasefire deal in the Middle East seems further away than ever. Israel stepped up its offensive after the rare pager and walkie-talkie explosion with bombardments on Libanon on Thursday. The offensive is a big setback for any negotiation and puts the region back on high alert.
Meanwhile, the US Dollar Index (DXY), which tracks the performance of the Greenback against six other currencies, is under pressure near the yearly lows and could break lower now that the US Federal Reserve (Fed) has joined other countries by starting its interest rate cutting cycle. This triggered a devaluation in the DXY that could have more room to go in the coming weeks.
At the time of writing, Crude Oil (WTI) trades at $70.65 and Brent Crude at $73.74.
Oil news and market movers: Escalations drive Crude higher
- The next step up in Israel attacking Lebanon is adding to more tensions in the Middle East.
- Reuters reports that Saudi Arabia saw its oil exports drop to a one-year low in July. The country exported 5.741 million barrels per day (bpd) in July, their lowest level since August 2023.
- Declining global crude stockpiles should support Oil prices going forward, pushing Brent back above $80 in the coming months, UBS analysts said in a note to clients, Reuters reports.
- The above argument was supported on Wednesday during the weekly Energy Information Administration (EIA) release, which saw inventories fall to a one-year low last week.
Oil Technical Analysis: Not the Fed, but the Middle East
Crude Oil price consolidates recent gains on Friday. With tensions in the Middle East back on the forefront while US strategic reserves are running lower, a surge in prices looks granted. Going forward, it will be key to see how demand will hold up with the heating season underway.
The first level to watch on the upside is $71.46 (the February 5 low), which returns to the table as the next level to look out for. Ultimately, a return to $75.27 (the January 12 high) is still possible but would likely come if a seismic shift in current balances occurs.
On the downside, the initial support remains at $67.11, a triple bottom in the summer of 2023. Further down, the next level in line is $64.38, the low from March and May 2023. Should that level face a second test and snap, $61.65 becomes a target, with $60.00 as a psychologically big figure just below it, at least tempting to be tested.
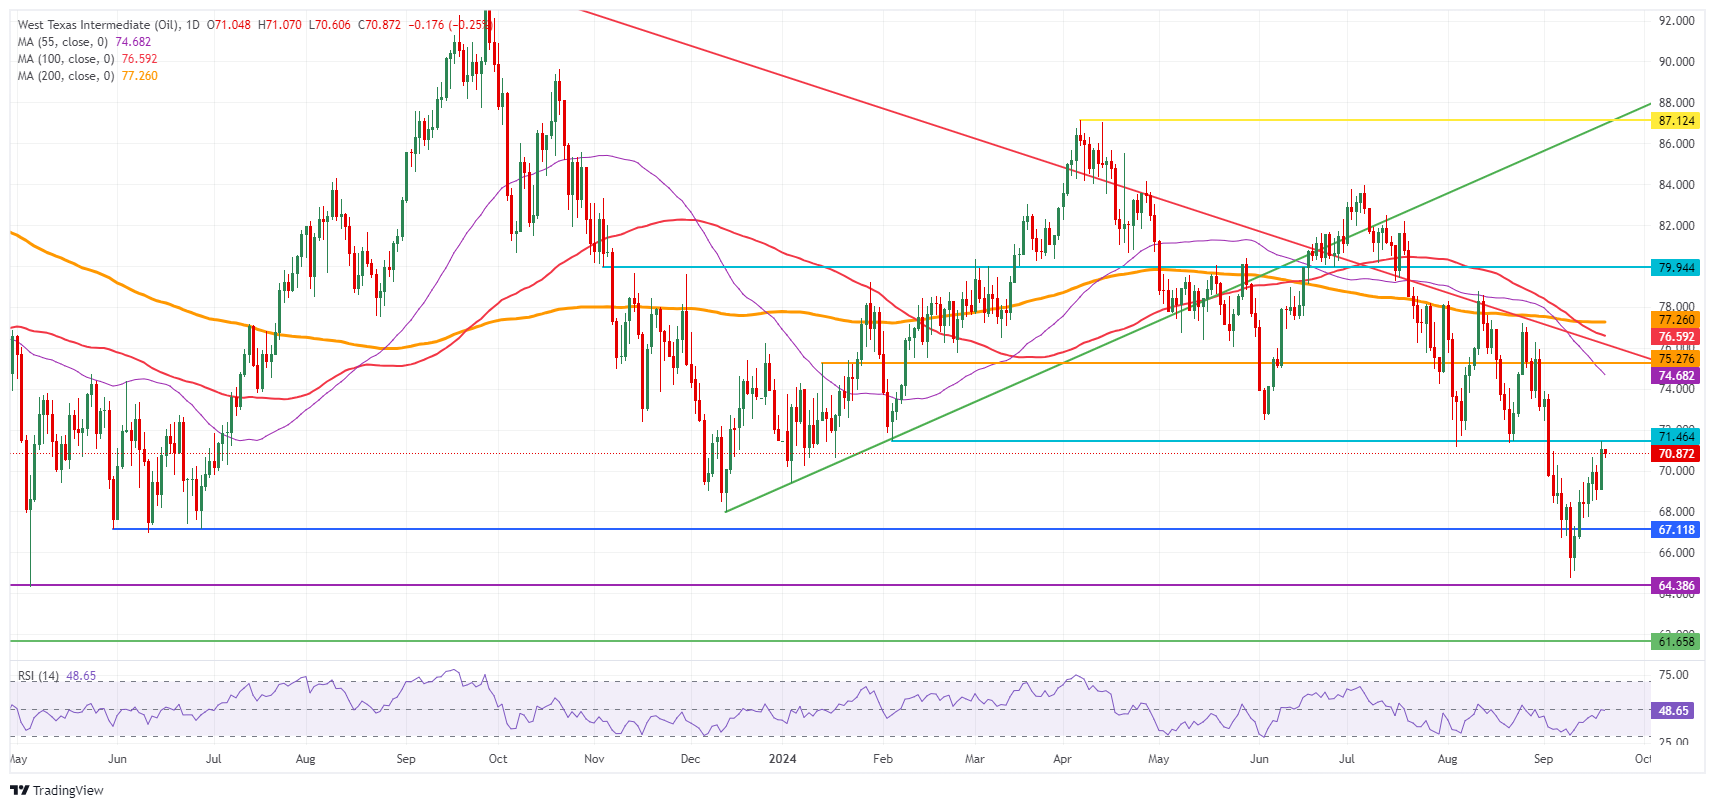
US WTI Crude Oil: Daily Chart
WTI Oil FAQs
WTI Oil is a type of Crude Oil sold on international markets. The WTI stands for West Texas Intermediate, one of three major types including Brent and Dubai Crude. WTI is also referred to as “light” and “sweet” because of its relatively low gravity and sulfur content respectively. It is considered a high quality Oil that is easily refined. It is sourced in the United States and distributed via the Cushing hub, which is considered “The Pipeline Crossroads of the World”. It is a benchmark for the Oil market and WTI price is frequently quoted in the media.
Like all assets, supply and demand are the key drivers of WTI Oil price. As such, global growth can be a driver of increased demand and vice versa for weak global growth. Political instability, wars, and sanctions can disrupt supply and impact prices. The decisions of OPEC, a group of major Oil-producing countries, is another key driver of price. The value of the US Dollar influences the price of WTI Crude Oil, since Oil is predominantly traded in US Dollars, thus a weaker US Dollar can make Oil more affordable and vice versa.
The weekly Oil inventory reports published by the American Petroleum Institute (API) and the Energy Information Agency (EIA) impact the price of WTI Oil. Changes in inventories reflect fluctuating supply and demand. If the data shows a drop in inventories it can indicate increased demand, pushing up Oil price. Higher inventories can reflect increased supply, pushing down prices. API’s report is published every Tuesday and EIA’s the day after. Their results are usually similar, falling within 1% of each other 75% of the time. The EIA data is considered more reliable, since it is a government agency.
OPEC (Organization of the Petroleum Exporting Countries) is a group of 13 Oil-producing nations who collectively decide production quotas for member countries at twice-yearly meetings. Their decisions often impact WTI Oil prices. When OPEC decides to lower quotas, it can tighten supply, pushing up Oil prices. When OPEC increases production, it has the opposite effect. OPEC+ refers to an expanded group that includes ten extra non-OPEC members, the most notable of which is Russia.
Empfohlene Artikel


