NZD/USD Price Forecast: Holds position above nine-day EMA near 0.6200

Quelle Fxstreet
  • NZD/USD may appreciate as daily chart analysis indicates a bullish bias.
  • The upper boundary of the ascending channel at 0.6280 appears as the immediate resistance.
  • The pair may find the support around the nine-day EMA at 0.6189 level.

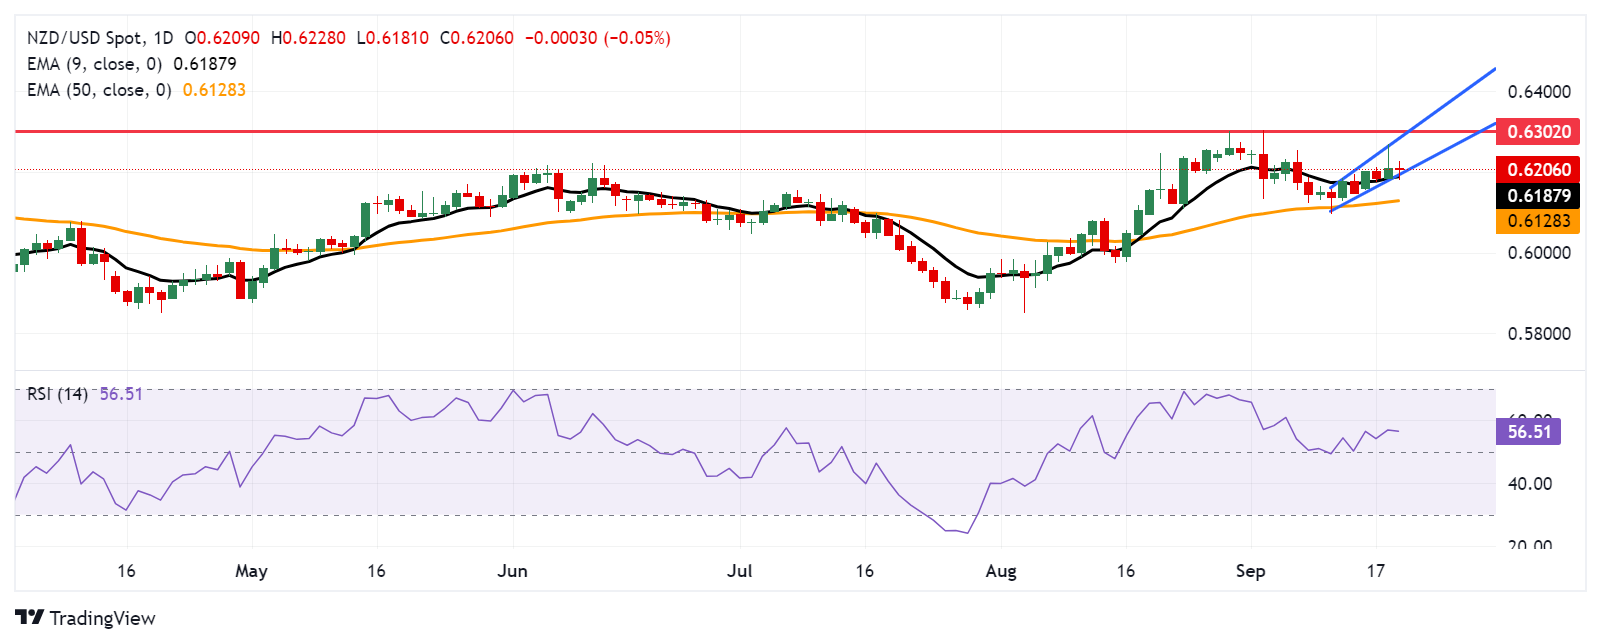
NZD/USD trades around 0.6210 during the Asian session on Thursday. On the daily chart, the pair is consolidating within an ascending channel pattern, indicating a bullish bias. However, a break below the lower boundary of the channel could diminish this bullish sentiment.

The 14-day Relative Strength Index (RSI) remains above the 50 level, confirming the ongoing bullish trend. Additionally, the nine-day Exponential Moving Average (EMA) is above the 50-day EMA, suggesting that the NZD/USD pair is experiencing short-term upward momentum and is likely to continue its rise.

On the upside, the NZD/USD pair may test the upper boundary of the ascending channel at the 0.6280 level, followed by the eight-month high of 0.6302 recorded on September 3. A break above this high could drive the pair toward the psychological level of 0.6300.

On the downside, the NZD/USD pair might test immediate support around the nine-day EMA at the 0.6189 level, which is near the lower boundary of the ascending channel. A break below this channel could weaken the bullish sentiment and put pressure on the pair to approach the 50-day EMA at 0.6128.

NZD/USD: Daily Chart
New Zealand Dollar PRICE Today

The table below shows the percentage change of New Zealand Dollar (NZD) against listed major currencies today. New Zealand Dollar was the strongest against the Japanese Yen.

  USD EUR GBP JPY CAD AUD NZD CHF
USD   0.01% 0.07% 0.63% -0.02% -0.34% 0.07% 0.32%
EUR -0.01%   0.05% 0.62% -0.03% -0.34% 0.05% 0.31%
GBP -0.07% -0.05%   0.57% -0.09% -0.42% -0.00% 0.24%
JPY -0.63% -0.62% -0.57%   -0.62% -0.96% -0.59% -0.32%
CAD 0.02% 0.03% 0.09% 0.62%   -0.33% 0.09% 0.33%
AUD 0.34% 0.34% 0.42% 0.96% 0.33%   0.41% 0.65%
NZD -0.07% -0.05% 0.00% 0.59% -0.09% -0.41%   0.26%
CHF -0.32% -0.31% -0.24% 0.32% -0.33% -0.65% -0.26%  

The heat map shows percentage changes of major currencies against each other. The base currency is picked from the left column, while the quote currency is picked from the top row. For example, if you pick the New Zealand Dollar from the left column and move along the horizontal line to the US Dollar, the percentage change displayed in the box will represent NZD (base)/USD (quote).

Haftungsausschluss: Nur zu Informationszwecken. Die bisherige Performance ist kein verlässlicher Indikator für zukünftige Ergebnisse.
placeholder
Goldpreis erreicht neues Allzeithoch vor Trumps Zoll-EntscheidungDer Goldpreis (XAU/USD) steigt erneut für den zweiten Tag in dieser Woche und für den ersten Tag des zweiten Quartals 2025.
Autor  FXStreet
Di. 01.Apr
Der Goldpreis (XAU/USD) steigt erneut für den zweiten Tag in dieser Woche und für den ersten Tag des zweiten Quartals 2025.
placeholder
Solana-Kursprognose für April 2025: FTX-Rückzahlungen ab 30. Mai setzen SOL-Trader unter Druck – droht Umkehr bei 120 USD?Der Solana-Kurs bewegte sich am Dienstag unterhalb der Marke von 130 US-Dollar seitwärts und sieht sich im April zunehmendem Gegenwind ausgesetzt, da Anleger angesichts bevorstehender FTX-Verkäufe vorsichtiger agieren.
Autor  FXStreet
Gestern 02: 39
Der Solana-Kurs bewegte sich am Dienstag unterhalb der Marke von 130 US-Dollar seitwärts und sieht sich im April zunehmendem Gegenwind ausgesetzt, da Anleger angesichts bevorstehender FTX-Verkäufe vorsichtiger agieren.
placeholder
Goldpreis schwankt über 3.100 $, nachdem Trump Zölle ankündigtDer Goldpreis stürzt ab und handelt volatil im Bereich von $3.100 - $3.135, nachdem US-Präsident Donald Trump weltweit reziproke Zölle verhängt hat, während die Einzelheiten noch veröffentlicht werden müssen.
Autor  FXStreet
vor 9 Stunden
Der Goldpreis stürzt ab und handelt volatil im Bereich von $3.100 - $3.135, nachdem US-Präsident Donald Trump weltweit reziproke Zölle verhängt hat, während die Einzelheiten noch veröffentlicht werden müssen.
placeholder
Bitcoin und führende Altcoins geraten unter Druck, nachdem Trump Gegenzölle einführtBitcoin (BTC) und der gesamte Kryptomarkt verzeichneten am Mittwoch eine kurzfristige Korrektur, nachdem Ex-Präsident Donald Trump Gegenzölle angekündigt hatte, die sich an der Hälfte der jeweiligen nationalen Zollsätze orientieren.
Autor  FXStreet
vor 8 Stunden
Bitcoin (BTC) und der gesamte Kryptomarkt verzeichneten am Mittwoch eine kurzfristige Korrektur, nachdem Ex-Präsident Donald Trump Gegenzölle angekündigt hatte, die sich an der Hälfte der jeweiligen nationalen Zollsätze orientieren.
placeholder
Bitcoin reagiert auf neue Allzeithochs bei Gold nach Trumps Ankündigung von GegenzöllenDer Bitcoin-Kurs stürzt in Richtung 82.000 US-Dollar ab, während Gold über die Marke von 3.150 US-Dollar steigt – ausgelöst durch neue Zölle von US-Präsident Donald Trump auf Israel und Großbritannien, die Turbulenzen an den globalen Märkten verursachten.
Autor  FXStreet
vor 7 Stunden
Der Bitcoin-Kurs stürzt in Richtung 82.000 US-Dollar ab, während Gold über die Marke von 3.150 US-Dollar steigt – ausgelöst durch neue Zölle von US-Präsident Donald Trump auf Israel und Großbritannien, die Turbulenzen an den globalen Märkten verursachten.
verbundene Finanzinstrumente
goTop
quote