
Australian Dollar holds gains following China’s trade balance data
- The Australian Dollar remains stronger following China’s import-export data released on Monday.
- China’s Trade Balance came in at $102.64B for March, against the previous $170.51B and expected $77B.
- The US Dollar is under pressure as weakening economic data and dovish signals from the Fed dampen investor confidence.
The Australian Dollar (AUD) extends its gains against the US Dollar (USD) on Monday, supported by improved risk sentiment. The AUD/USD pair rose after US President Donald Trump announced less severe tariffs late Sunday on Chinese imports, including semiconductors and electronics. Clarifying earlier speculation about exemptions, Trump confirmed these goods would remain subject to the existing 20% tariffs related to fentanyl rather than the previously suggested 145% duties.
Stronger commodity prices provided further support for the Australian Dollar. However, persistent trade tensions between the US and China continue to weigh on the outlook, especially given Australia’s heavy reliance on Chinese demand and exports.
China’s Trade Balance for March, measured in Chinese Yuan (CNY), recorded a substantial increase to CNY 736.72 billion, up sharply from CNY 122 billion in the previous month. In US Dollar (USD) terms, the trade surplus also exceeded expectations, coming in at $102.6 billion—well above the forecast of $77 billion, though lower than the prior $170.51 billion.
The General Administration of Customs of China acknowledged the challenges facing the country’s exports, calling the current external environment “complex and severe.” Despite this, officials expressed confidence, stating that “the sky will not fall.” They reported a solid start to the year, with foreign trade showing growth in both volume and quality. The agency also emphasized China’s commitment to enforcing all measures necessary to counter US actions and to uphold its national sovereignty and security.
Australian Dollar rises as US Dollar struggles amid eroding investor confidence
- The US Dollar Index (DXY), which tracks the USD against a basket of six major currencies, extended its losses for the third consecutive session, slipping below 100.00 and nearing Friday’s three-year low of 99.01. The continued decline reflects eroding investor confidence amid downbeat economic indicators and dovish central bank commentary.
- The University of Michigan’s sentiment index dropped to 50.8 in April, while one-year inflation expectations surged to 6.7%. The US Producer Price Index (PPI) rose 2.7% year-over-year in March, down from 3.2% in February, with the core rate easing to 3.3%. Jobless claims ticked up to 223,000, although continuing claims declined to 1.85 million—pointing to a mixed picture in the labor market.
- On Sunday, Minneapolis Federal Reserve President Neel Kashkari said on CBS' Face the Nation that the economic fallout from Trump’s trade war would largely depend on how quickly trade uncertainties are resolved. “This is the biggest hit to confidence that I can recall in the 10 years I’ve been at the Fed—except for March 2020 when COVID first hit,” Kashkari remarked.
- The Greenback also faces additional headwinds from rising trade tensions between the US and China, which have reignited fears of a global economic slowdown. On Friday, China’s Ministry of Finance announced a steep increase in tariffs on US goods, raising duties from 84% to 125%. This move followed President Trump’s earlier decision to hike tariffs on Chinese imports to 145%.
- The US Consumer Price Index (CPI) inflation eased to 2.4% year-over-year in March, down from 2.8% in February and below the market forecast of 2.6%. Core CPI, which excludes food and energy prices, rose 2.8% annually, compared to 3.1% previously and missing the 3.0% estimate. On a monthly basis, headline CPI dipped by 0.1%, while core CPI edged up by 0.1%.
- Minutes from the latest Federal Open Market Committee (FOMC) Meeting suggested that policymakers are nearly unanimous in recognizing the dual challenge of rising inflation and slowing growth, cautioning that the Federal Reserve faces “difficult tradeoffs” in the months ahead.
- China’s Exports rose 13.5% year-over-year in March, accelerating from 3.4% in February, while imports declined 3.5% YoY, a smaller drop compared to the 7.3% contraction previously reported.
- The People's Bank of China (PBoC) is expected to implement further monetary easing in Q2 2025. This includes a potential 15 basis point cut to the loan prime rate (LPR) and a minimum 25 basis point reduction in the reserve requirement ratio (RRR). According to Citi analysts, cited in a Reuters report, there’s an increasing likelihood that domestic stimulus measures will be accelerated in response to mounting external pressures.
- On Thursday, the AUD found support from reports that Australia is preparing to resume trade negotiations with the European Union (EU). Moreover, the Wall Street Journal reported that China also held talks with EU trade chief Maros Sefcovic, expressing interest in strengthening trade, investment, and industrial cooperation with the bloc.
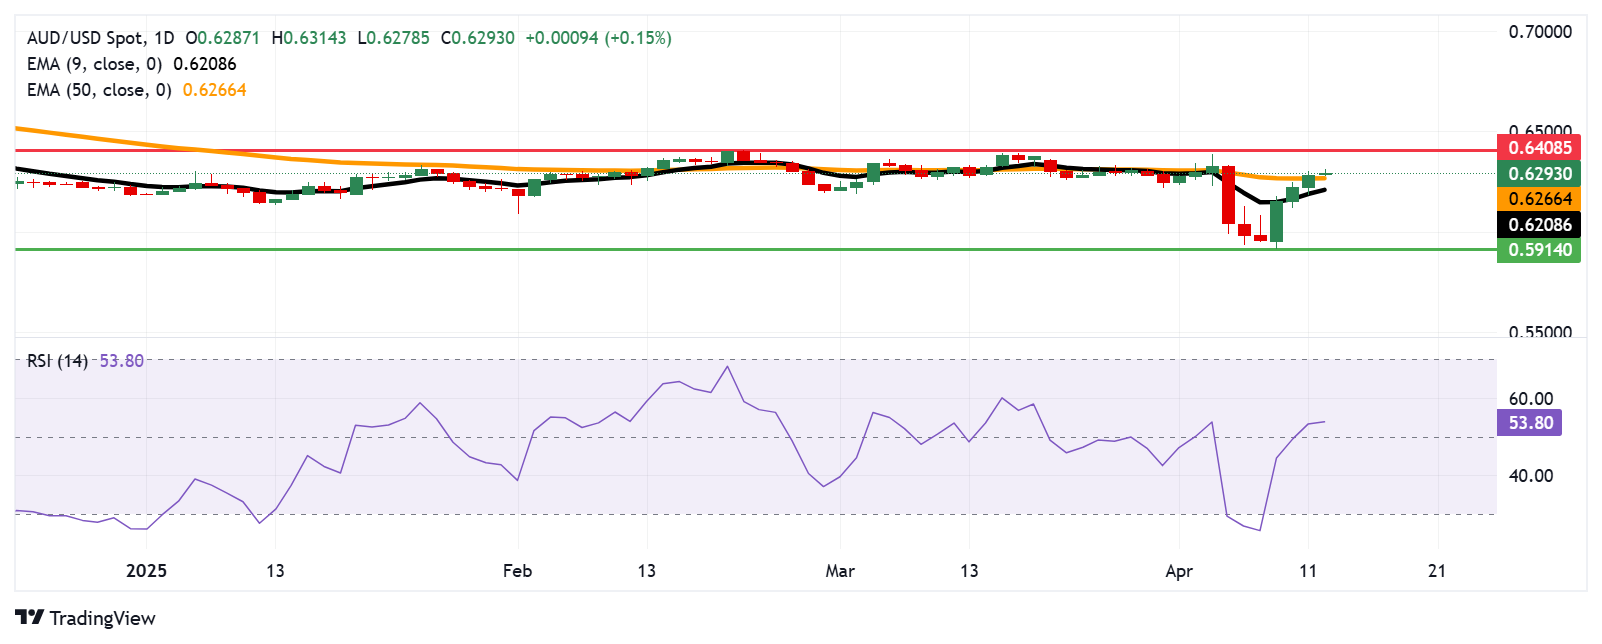
Australian Dollar tests 0.6300 after surpassing 50-day EMA
The AUD/USD pair is hovering around the 0.6300 level on Monday. Technical indicators on the daily chart suggest a mild bullish bias, with the pair trading above both the nine-day and 50-day Exponential Moving Averages (EMAs). The 14-day Relative Strength Index (RSI) has also climbed above the 50 threshold, further supporting the bullish outlook.
On the upside, the AUD/USD pair could target the psychological resistance at 0.6400, followed by the four-month high at 0.6408.
Immediate support lies at the 50-day EMA at 0.6266, with additional support at the nine-day EMA of 0.6210. A clear break below this level could weaken the short-term bullish structure and expose the pair to further downside toward the 0.5914 area—its lowest since March 2020—and the key psychological level at 0.5900.
AUD/USD: Daily Chart
Australian Dollar PRICE Today
The table below shows the percentage change of Australian Dollar (AUD) against listed major currencies today. Australian Dollar was the strongest against the US Dollar.
| USD | EUR | GBP | JPY | CAD | AUD | NZD | CHF | |
|---|---|---|---|---|---|---|---|---|
| USD | -0.03% | -0.16% | -0.62% | -0.02% | -0.12% | -0.27% | -0.20% | |
| EUR | 0.03% | 0.36% | -0.16% | 0.46% | 0.66% | 0.19% | 0.26% | |
| GBP | 0.16% | -0.36% | -0.13% | 0.09% | 0.30% | -0.17% | -0.09% | |
| JPY | 0.62% | 0.16% | 0.13% | 0.58% | 0.26% | 0.12% | 0.57% | |
| CAD | 0.02% | -0.46% | -0.09% | -0.58% | -0.06% | -0.25% | -0.26% | |
| AUD | 0.12% | -0.66% | -0.30% | -0.26% | 0.06% | -0.46% | -0.39% | |
| NZD | 0.27% | -0.19% | 0.17% | -0.12% | 0.25% | 0.46% | 0.09% | |
| CHF | 0.20% | -0.26% | 0.09% | -0.57% | 0.26% | 0.39% | -0.09% |
The heat map shows percentage changes of major currencies against each other. The base currency is picked from the left column, while the quote currency is picked from the top row. For example, if you pick the Australian Dollar from the left column and move along the horizontal line to the US Dollar, the percentage change displayed in the box will represent AUD (base)/USD (quote).
Economic Indicator
Trade Balance USD
The Trade Balance released by the General Administration of Customs of the People’s Republic of China is a balance between exports and imports of total goods and services. A positive value shows trade surplus, while a negative value shows trade deficit. It is an event that generates some volatility for the CNY. As the Chinese economy has influence on the global economy, this economic indicator would have an impact on the Forex market. In general, a high reading is seen as positive (or bullish) CNY, while a low reading is seen as negative (or bearish) for the CNY.
Read more.Last release: Mon Apr 14, 2025 03:00
Frequency: Monthly
Actual: $102.64B
Consensus: $77B
Previous: $170.51B
Source: National Bureau of Statistics of China
추천 기사


