


US Dollar recovers some of previous losses with all eyes on NFP and Powell speech
- The Greenback is partially recovering lost ground against most major peers.
- Focus shifts now to the Nonfarm Payrolls and Fed Chairman Jerome Powell speaking.
- The US Dollar Index is heading back above 102.00.
The US Dollar Index (DXY), which tracks the performance of the US Dollar (USD) against six major currencies, is trying to recover while trading around 102.50 at the time of writing on Friday. The dust is settling on United States (US) President Donald Trump’s reciprocal tariffs. The focus now shifts towards the Nonfarm Payrolls (NFP) data release and Federal Reserve (Fed) Chair Jerome Powell’s speech up next.
On the economic calendar front, expectations for the NFP range from 80,000 to 200,000, with the consensus view at 135,000 for March’s performance. Seeing the slide in JOLTS Job Openings and the surge in Challenger Job Cuts announcements this week, the question will be if that 135,000 is not an overly-elevated expectation. Markets can look for guidance from Powell, who will speak briefly thereafter.
Daily digest market movers: Last NFP standing
- At 12:30 GMT, US employment data for March will be released:
- Nonfarm Payrolls are expected to come in at 135,000 compared to 151,000 in February. A drop below 80,000 could see some more USD weakness whereas a number above 200,000 would see a stronger USD.
- The monthly Average Hourly Earnings should remain stable at 0.3%.
- The Unemployment Rate is expected to come in at 4.1% as in February.
- At 15:25 GMT, Federal Reserve Chair Jerome Powell speaks about the economic outlook at the Society for Advancing Business Editing and Writing (SABEW) Annual Conference.
- At 16:00 GMT, Fed Governor Michael Barr will speak on AI and Banking.
- Fed Governor Chris Waller will speak at 16:45 GMT on Payments at a New York Fed Conference.
- Asian and European Equities sink again between 1% to 2% on average. US futures are looking heavy as well ahead of the US opening bell, though losses are contained to less than 1%.
- According to the CME Fedwatch Tool, the probability of interest rates remaining at the current range of 4.25%-4.50% in May’s meeting is 68.1%, coming from 81.5% last week. For June’s meeting, the odds for borrowing costs being lower stand at 92.6%, whereas only last week, the odds were roughly 81.1%.
- The US 10-year yields trade around 3.95%, a fresh five-month low with the next low to bear near 3.69% from the beginning of October 2024.
US Dollar Index Technical Analysis: There goes the pendulum
The pendulum is swinging for the US Dollar Index, with strength on the left and weakness on the right. On the left, there have been years of US Dollar strength, which was perceived as a market standard. However, since the start of March – with the defense budget spending bill in Germany and US President Donald Trump in office – the pendulum for the DXY has swung. More US Dollar weakness is likely once the tariff impact on the US economy starts to take its effect. As stagflation and recession fears are picking up, the DXY could easily fall below 100.00 later this year.
With the sizable downward move on Thursday, some support levels have turned into resistance. The first level to watch out for is 103.18, which has been held as support throughout March. Above there, the 104.00 pivotal level and the 200-day Simple Moving Average (SMA) at 104.89 come into play.
On the downside, 101.90 is the first line of defense and it should be able to trigger a bounce as the Relative Strength Index (RSI) momentum indicator is issuing warnings of oversold conditions on the daily chart. Maybe not this Friday, but in the coming days, a break below 101.90 could see a leg lower towards 100.00.
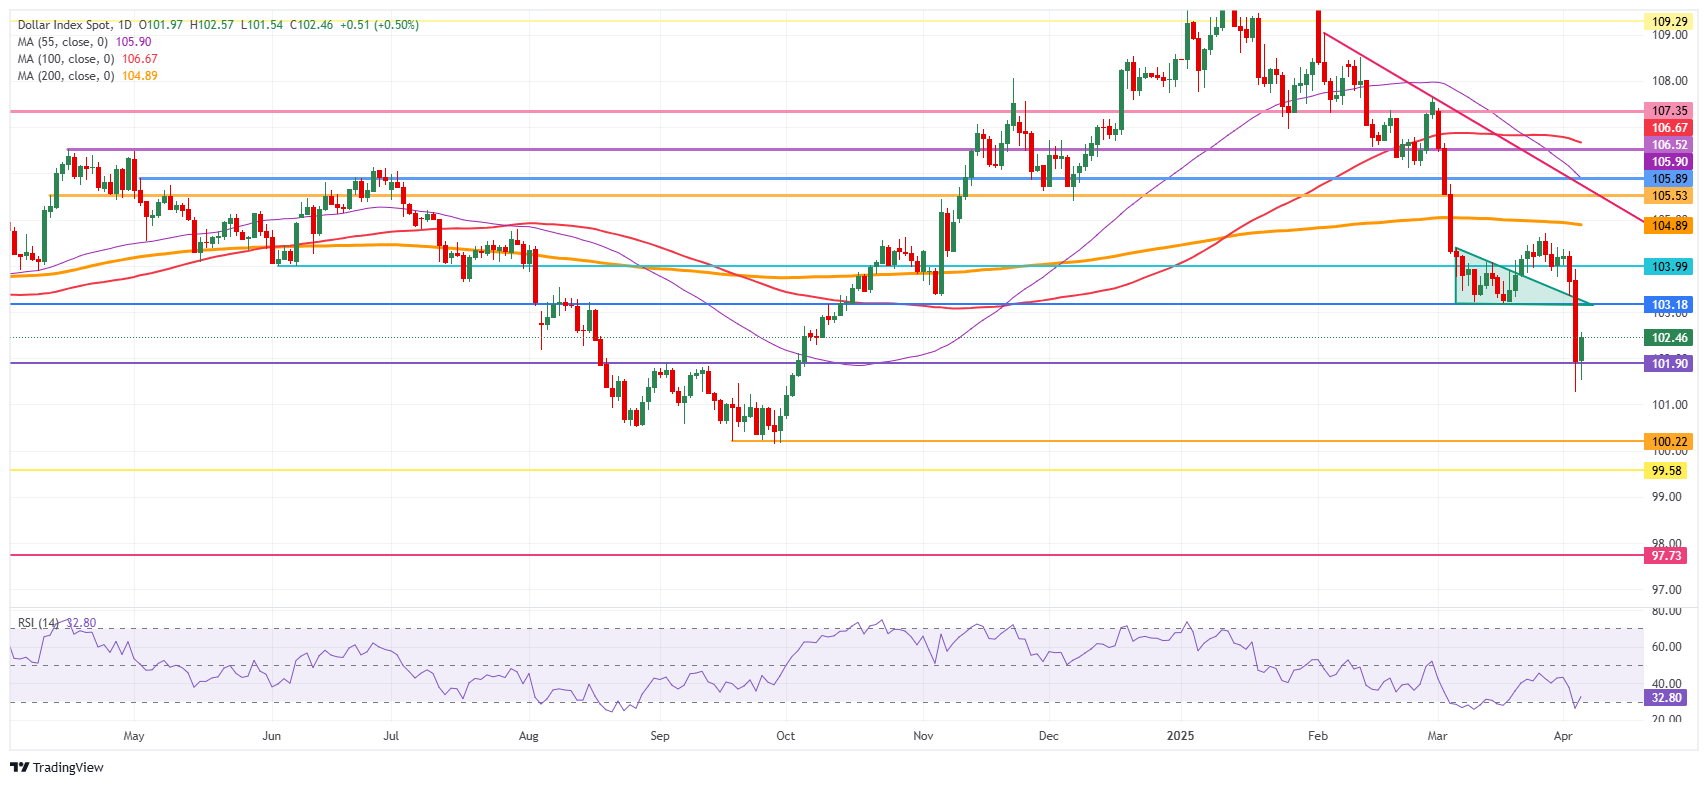
US Dollar Index: Daily Chart
US Dollar FAQs
The US Dollar (USD) is the official currency of the United States of America, and the ‘de facto’ currency of a significant number of other countries where it is found in circulation alongside local notes. It is the most heavily traded currency in the world, accounting for over 88% of all global foreign exchange turnover, or an average of $6.6 trillion in transactions per day, according to data from 2022. Following the second world war, the USD took over from the British Pound as the world’s reserve currency. For most of its history, the US Dollar was backed by Gold, until the Bretton Woods Agreement in 1971 when the Gold Standard went away.
The most important single factor impacting on the value of the US Dollar is monetary policy, which is shaped by the Federal Reserve (Fed). The Fed has two mandates: to achieve price stability (control inflation) and foster full employment. Its primary tool to achieve these two goals is by adjusting interest rates. When prices are rising too quickly and inflation is above the Fed’s 2% target, the Fed will raise rates, which helps the USD value. When inflation falls below 2% or the Unemployment Rate is too high, the Fed may lower interest rates, which weighs on the Greenback.
In extreme situations, the Federal Reserve can also print more Dollars and enact quantitative easing (QE). QE is the process by which the Fed substantially increases the flow of credit in a stuck financial system. It is a non-standard policy measure used when credit has dried up because banks will not lend to each other (out of the fear of counterparty default). It is a last resort when simply lowering interest rates is unlikely to achieve the necessary result. It was the Fed’s weapon of choice to combat the credit crunch that occurred during the Great Financial Crisis in 2008. It involves the Fed printing more Dollars and using them to buy US government bonds predominantly from financial institutions. QE usually leads to a weaker US Dollar.
Quantitative tightening (QT) is the reverse process whereby the Federal Reserve stops buying bonds from financial institutions and does not reinvest the principal from the bonds it holds maturing in new purchases. It is usually positive for the US Dollar.
추천 기사


