
EUR/USD Price Analysis: Euro holds gains after European session amid bullish signals
- EUR/USD trades around the mid-1.13/1.14 zone after gaining during Monday's session.
- Overall bullish signals supported by key moving averages, despite mixed momentum indicators.
- Support sits near 1.1350 and 1.1340, with resistance found around 1.1380.
After the European session on Monday, EUR/USD was seen trading near the mid-1.13/1.14 area, maintaining a positive tone on the day with a modest gain. Despite the RSI holding a neutral stance and the MACD flashing a sell signal, the broader technical setup remains tilted to the upside. Momentum indicators and key moving averages continue to back the bullish view, while immediate support and resistance levels define a well-contained range around the recent action.
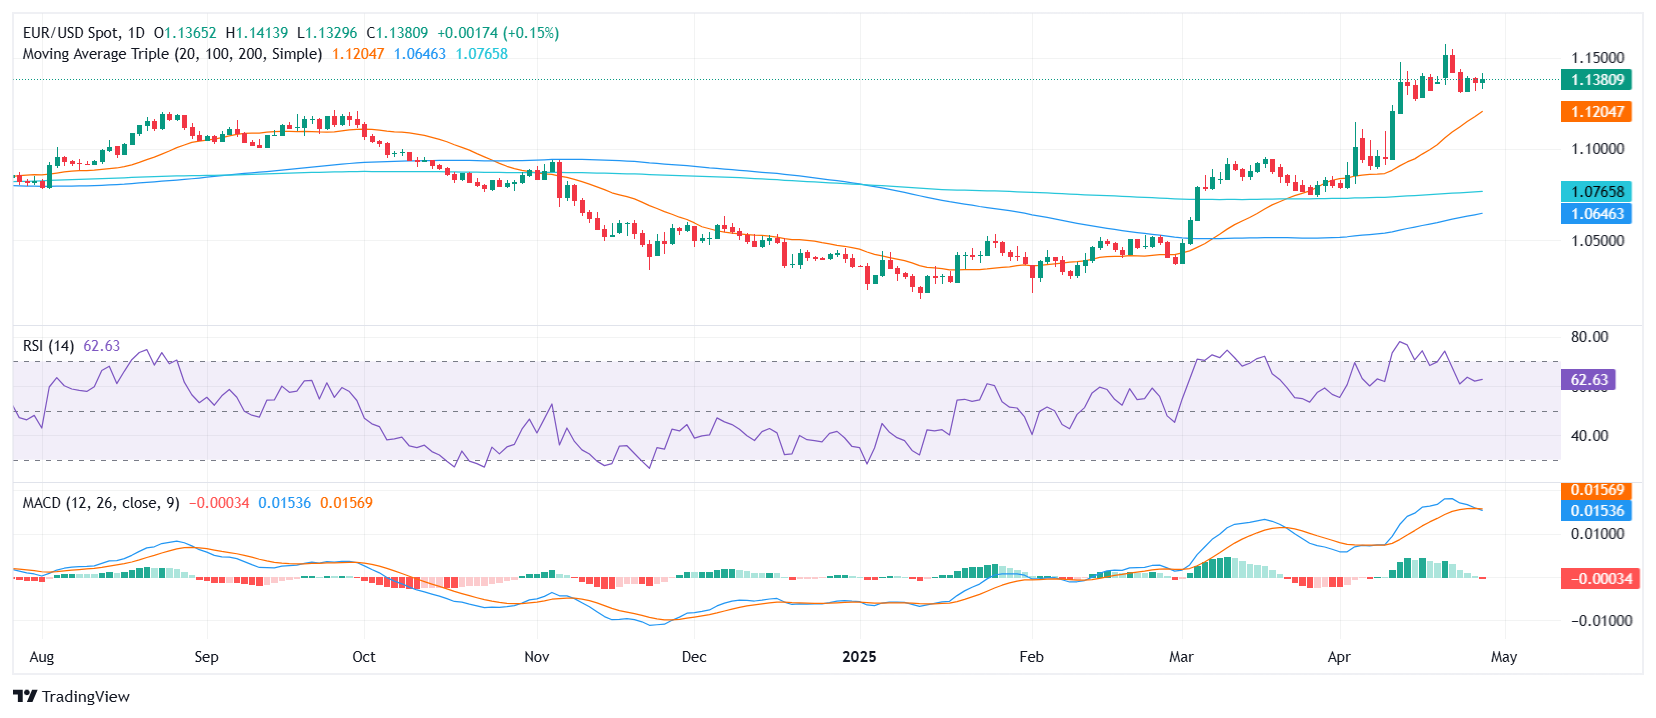
The pair's technical picture shows a mixed but overall constructive bias. The Relative Strength Index (RSI) sits around 63, suggesting a neutral tone without strong overbought or oversold conditions. Meanwhile, the Moving Average Convergence Divergence (MACD) indicator points to a slight bearish divergence, contrasting with the Momentum indicator, which leans positively, and the Bull Bear Power indicator that remains flat.
However, the main bullish conviction stems from the positioning of moving averages. The 20-day Simple Moving Average (SMA) is aligned around 1.1208, comfortably below the current spot, while the 100-day and 200-day SMAs, at 1.0651 and 1.0771 respectively, further validate the bullish case. Additionally, the 10-day and 30-day Exponential Moving Averages (EMAs) stationed around 1.1341 and 1.1130 respectively, keep reinforcing the positive outlook.
In terms of levels to watch, immediate support is found at 1.1354, followed closely by 1.1341 and deeper at 1.1230. On the upside, resistance awaits at 1.1380, which if cleared could open the door for further gains toward the upper parts of the recent trading range.
Daily Chart
추천 기사


