
Silver Price Forecast: XAG/USD trades around mid-$33.00s; just below multi-week top
- Silver eases from a three-week high retested earlier this Friday.
- The setup supports prospects for the emergence of dip-buyers.
- A break below the $32.00 mark might negate the positive bias.
Silver (XAG/USD) edges lower after testing the three-week top during the Asian session on Friday and currently trades around the mid-$33.00s, down 0.30% for the day. The technical setup, however, warrants caution before positioning for any meaningful depreciating move.
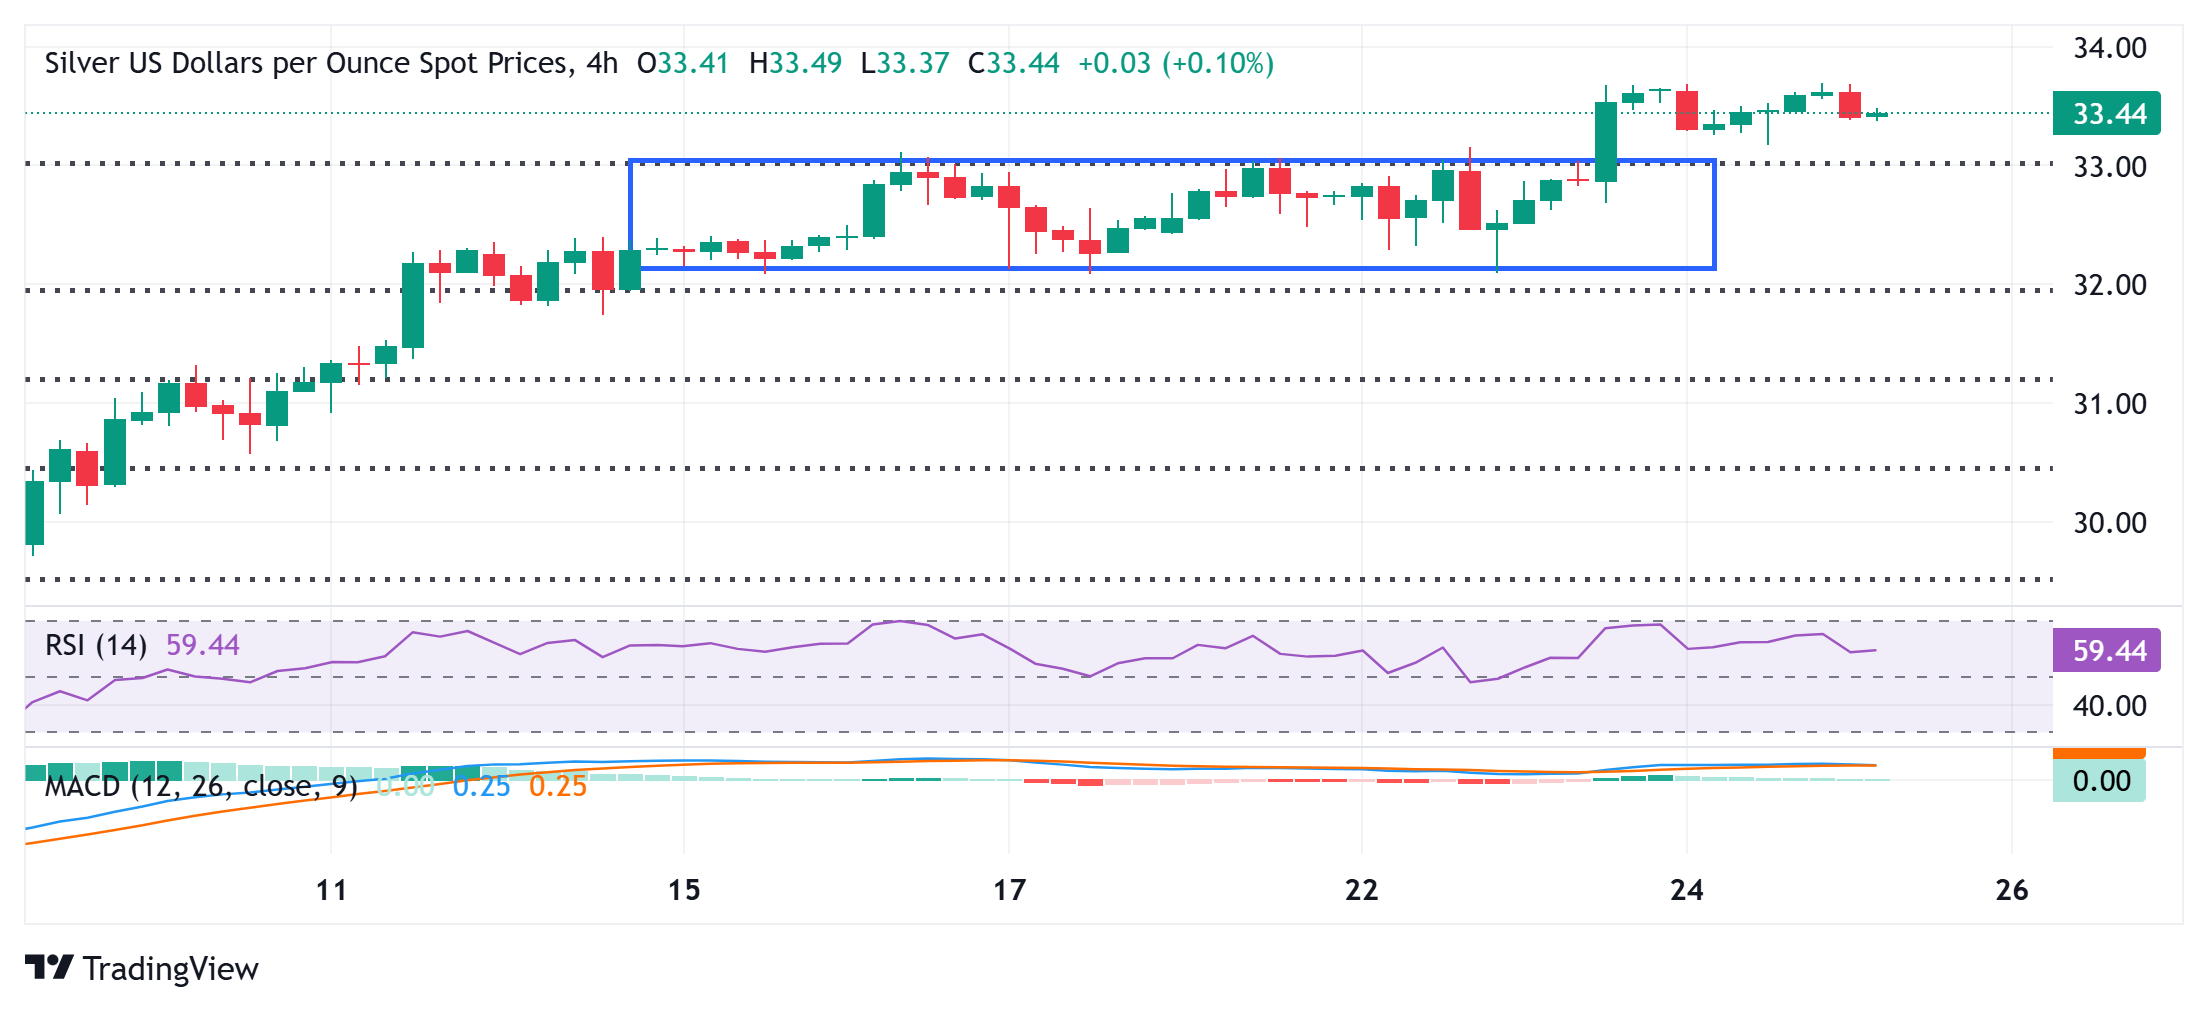
This week's breakout above the $33.00 round figure, representing the top end of a multi-day-old range and the 61.8% Fibonacci retracement level of the March-April downfall, was seen as a key trigger for bullish traders. Moreover, oscillators on the daily chart have been gaining positive traction and are still far from being in the overbought territory. This, in turn, suggests that the path of least resistance for the XAG/USD is to the upside.
Hence, any subsequent slide might still be seen as a buying opportunity near the $33.00 hurdle breakpoint, now turned support. A convincing break below the said handle might prompt some technical selling and drag the XAG/USD further toward the $32.40 support en route to the $32.10-$32.00 area. Some follow-through selling will suggest that the recent recovery from the $28.00 mark, or the year-to-date low, has run out of steam.
On the flip side, the $33.70 area now seems to have emerged as an immediate hurdle, above which the XAG/USD could aim to reclaim the $34.00 mark. The momentum could extend further towards the $34.30 intermediate resistance en route to the next relevant barrier near the $34.55-$34.60 region, or the highest level since October 2024 touched last month. The white metal could eventually aim to conquer the $35.00 psychological mark.
Silver 4-hour chart
Silver FAQs
Silver is a precious metal highly traded among investors. It has been historically used as a store of value and a medium of exchange. Although less popular than Gold, traders may turn to Silver to diversify their investment portfolio, for its intrinsic value or as a potential hedge during high-inflation periods. Investors can buy physical Silver, in coins or in bars, or trade it through vehicles such as Exchange Traded Funds, which track its price on international markets.
Silver prices can move due to a wide range of factors. Geopolitical instability or fears of a deep recession can make Silver price escalate due to its safe-haven status, although to a lesser extent than Gold's. As a yieldless asset, Silver tends to rise with lower interest rates. Its moves also depend on how the US Dollar (USD) behaves as the asset is priced in dollars (XAG/USD). A strong Dollar tends to keep the price of Silver at bay, whereas a weaker Dollar is likely to propel prices up. Other factors such as investment demand, mining supply – Silver is much more abundant than Gold – and recycling rates can also affect prices.
Silver is widely used in industry, particularly in sectors such as electronics or solar energy, as it has one of the highest electric conductivity of all metals – more than Copper and Gold. A surge in demand can increase prices, while a decline tends to lower them. Dynamics in the US, Chinese and Indian economies can also contribute to price swings: for the US and particularly China, their big industrial sectors use Silver in various processes; in India, consumers’ demand for the precious metal for jewellery also plays a key role in setting prices.
Silver prices tend to follow Gold's moves. When Gold prices rise, Silver typically follows suit, as their status as safe-haven assets is similar. The Gold/Silver ratio, which shows the number of ounces of Silver needed to equal the value of one ounce of Gold, may help to determine the relative valuation between both metals. Some investors may consider a high ratio as an indicator that Silver is undervalued, or Gold is overvalued. On the contrary, a low ratio might suggest that Gold is undervalued relative to Silver.
추천 기사


