
Solana Price Analysis: Bears to double down despite 15% losses in four days
- Solana price stabilized around the $170 mark on Wednesday, posting a 5-day losing streak.
- A cluster of $138 million in leveraged positions suggests Solana’s most significant support lies at the $160 territory.
- Declining trading volumes signal insufficient momentum for a sustained recovery phase.
Solana price stabilized around the $170 mark on Wednesday, posting five consecutive losing sessions. Declining market volumes suggest SOL continues to struggle to find buyers. Will bears hold out for another major price correction in the days ahead?
Solana (SOL) struggles to find buyers as $170 support wobbles
Solana managed to stabilize around $170 on Wednesday, as holders look to snap a rut of a 15% decline in four consecutive days of losses since the start of the week.
However, declining transaction volumes suggest traders appear reluctant to enter large positions.
Since the United States (US) Securities and Exchange Commission (SEC) acknowledged CoinShares' Litecoin (LTC) and XRP ETFs on Friday, Solana has slipped downward in investors’ mindshare as speculation swirls that a decision on SOL ETFs could take longer than the aforementioned two.
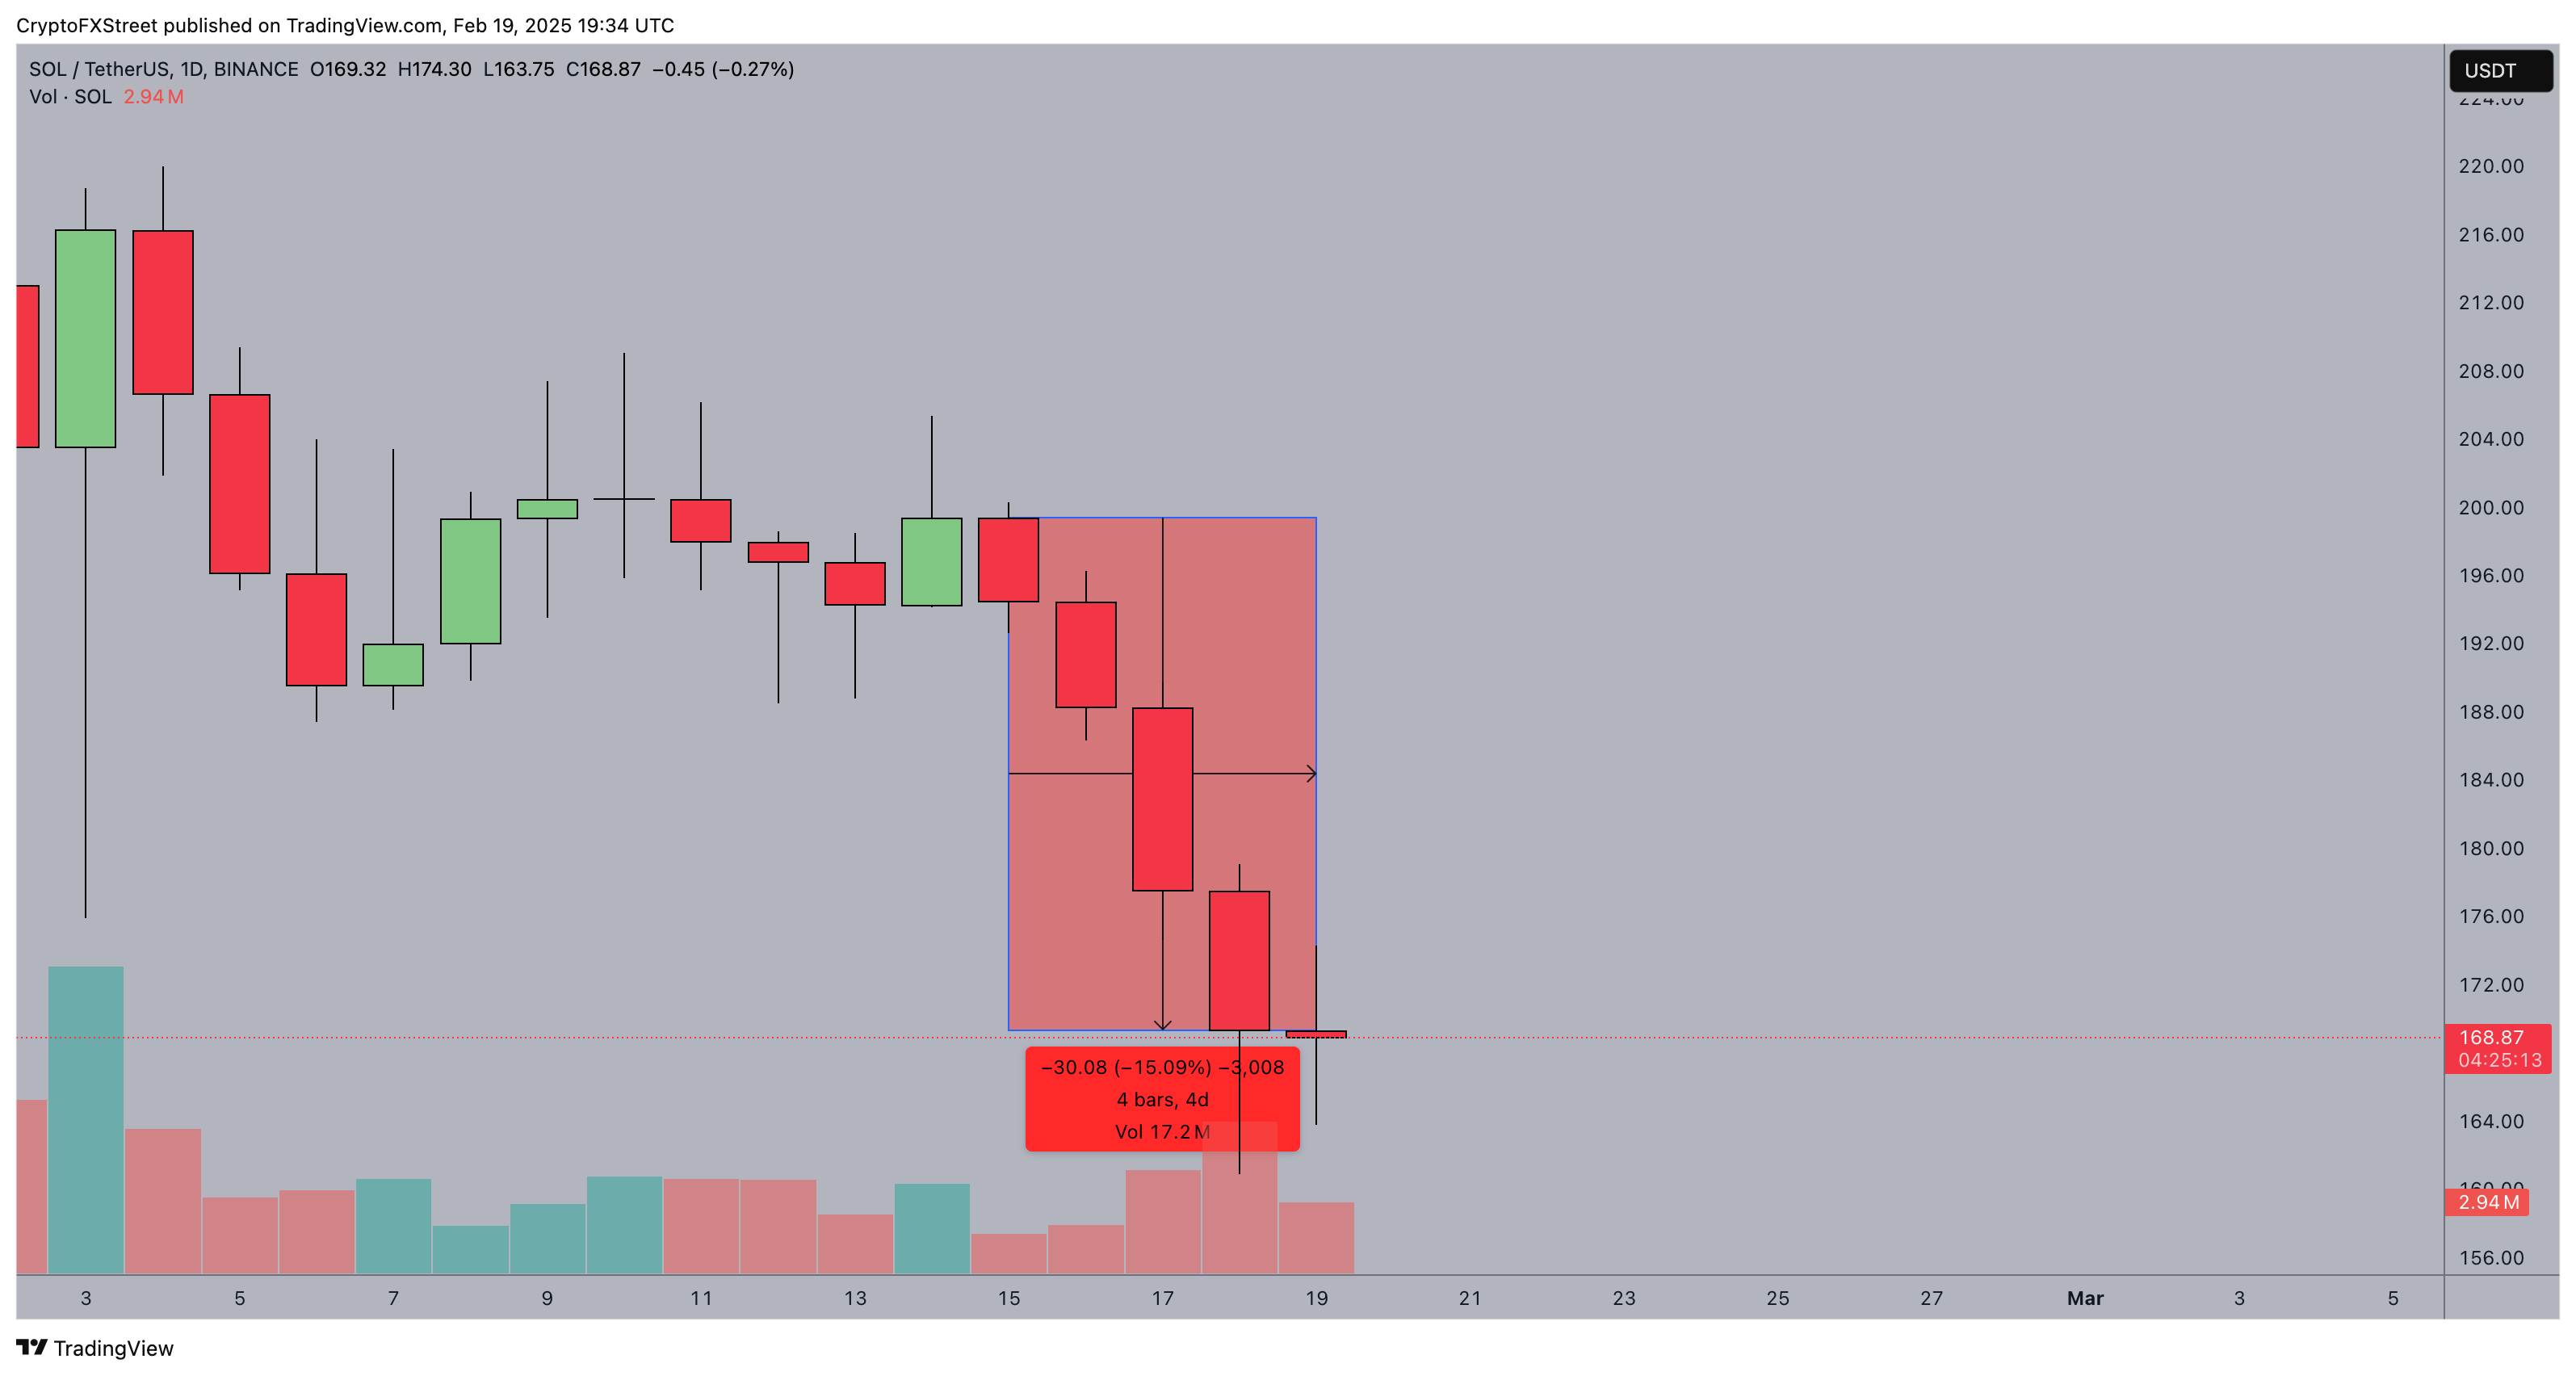
Solana Price Action | SOLUSDT
Emphasizing this stance, the SOL/USDT price chart shows that SOL has declined for four consecutive days since the SEC acknowledged the LTC and XRP ETFs last Friday.
The flat price action and lack of strong buying interest on Wednesday indicate that Solana is struggling to find buyers, placing the $170 support level under significant pressure.
SOL at risk of further losses if bears capitalize on weak support clusters
Solana’s flat price action and declining momentum suggest that it is struggling to attract significant buying interest, making it susceptible to further downside.
However, derivatives trading data reinforces a bearish sentiment.
Supporting this outlook, Coinglass’ SOL Liquidation heatmap chart below reveals that Solana's total short leverage positions amount to $551 million, significantly exceeding the total long leverage contracts of $253 million.
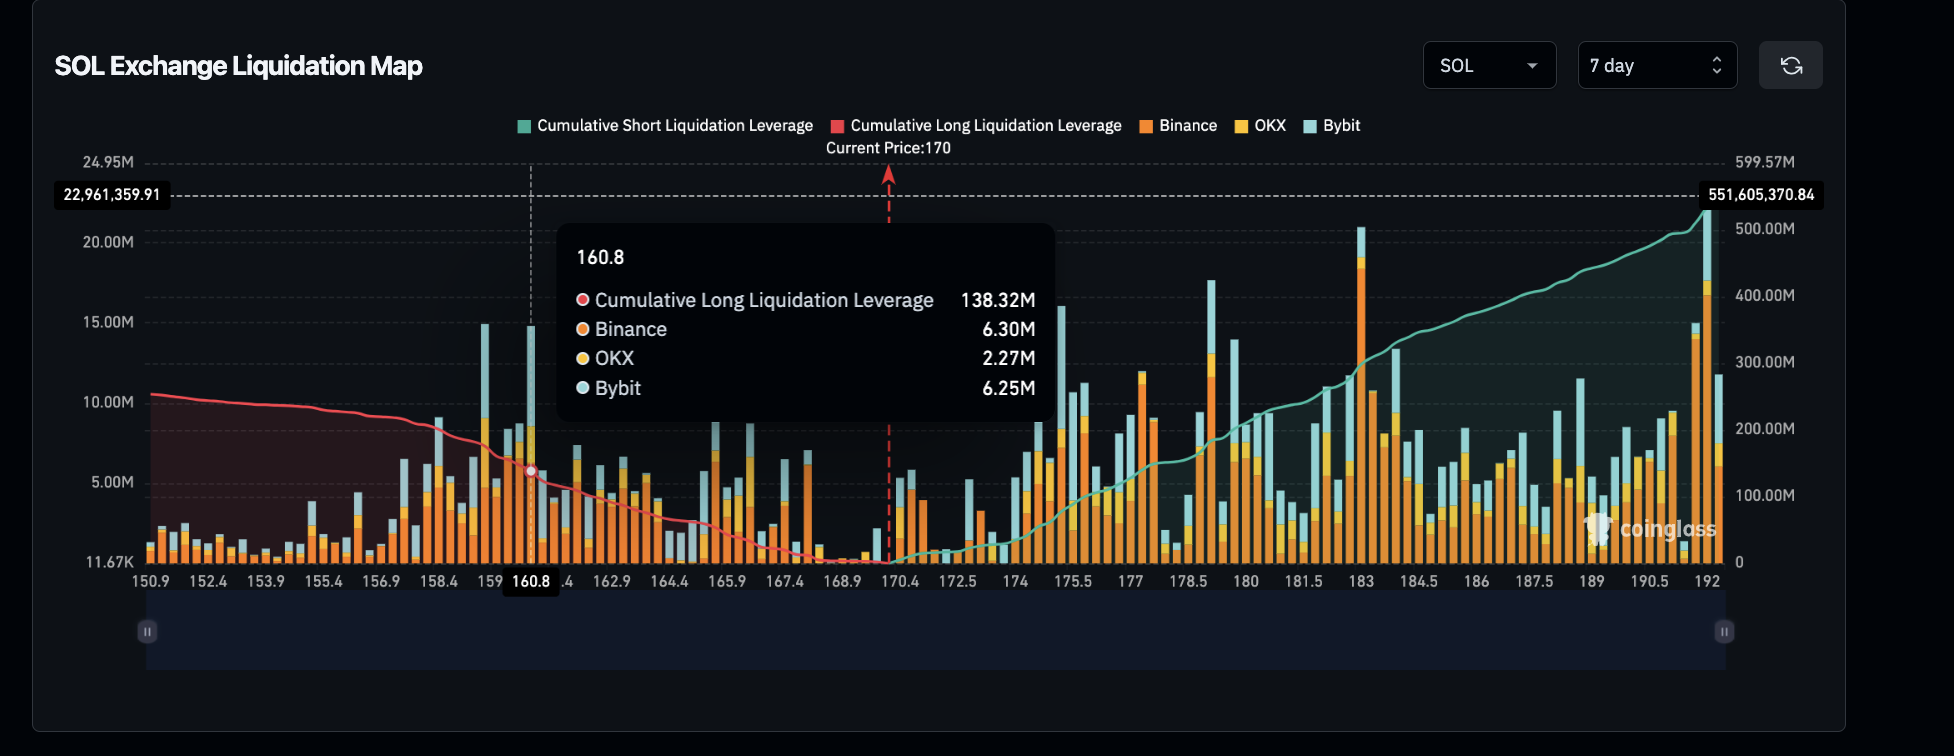
Solana Liquidation Map | Source: Coinglass
Additionally, a cluster of $138 million in leverage positions highlights that Solana’s most significant support level lies at the $160.8 territory.
Hence, if selling pressure intensifies and SOL price breaches the $170 support, bears could capitalize on the weaker support levels below it, potentially driving SOL toward the $160.8 support cluster in the days ahead.
Without a major bullish catalyst to reignite demand, Solana remains vulnerable to deeper retracements.
The absence of strong trading volumes amid persistent selling pressure signals major downside risks ahead.
For SOL to reverse its losses and regain bullish momentum, it would require a decisive break above $180, supported by a surge in trading volume and renewed investor confidence. Until then, bears appear poised to extend the current downtrend.
Solana Price Forecast: Multi-day close below $170 could strengthen bearish pressure
Solana price has extended its bearish decline, shedding over 15% in four days to test the $170 support level.
The daily SOL/USDT chart reveals a steady downward trajectory within the Keltner Channel’s lower boundary, suggesting that selling pressure remains dominant.
Despite Tuesday’s minor rebound to $169.71, the absence of a volume surge—evidenced by the 17.18 million daily trading volume—signals weak buying conviction.
The VWAP indicator, hovering at $169.25, confirms a lack of upward momentum, reinforcing the risk of a continued bearish breakdown.
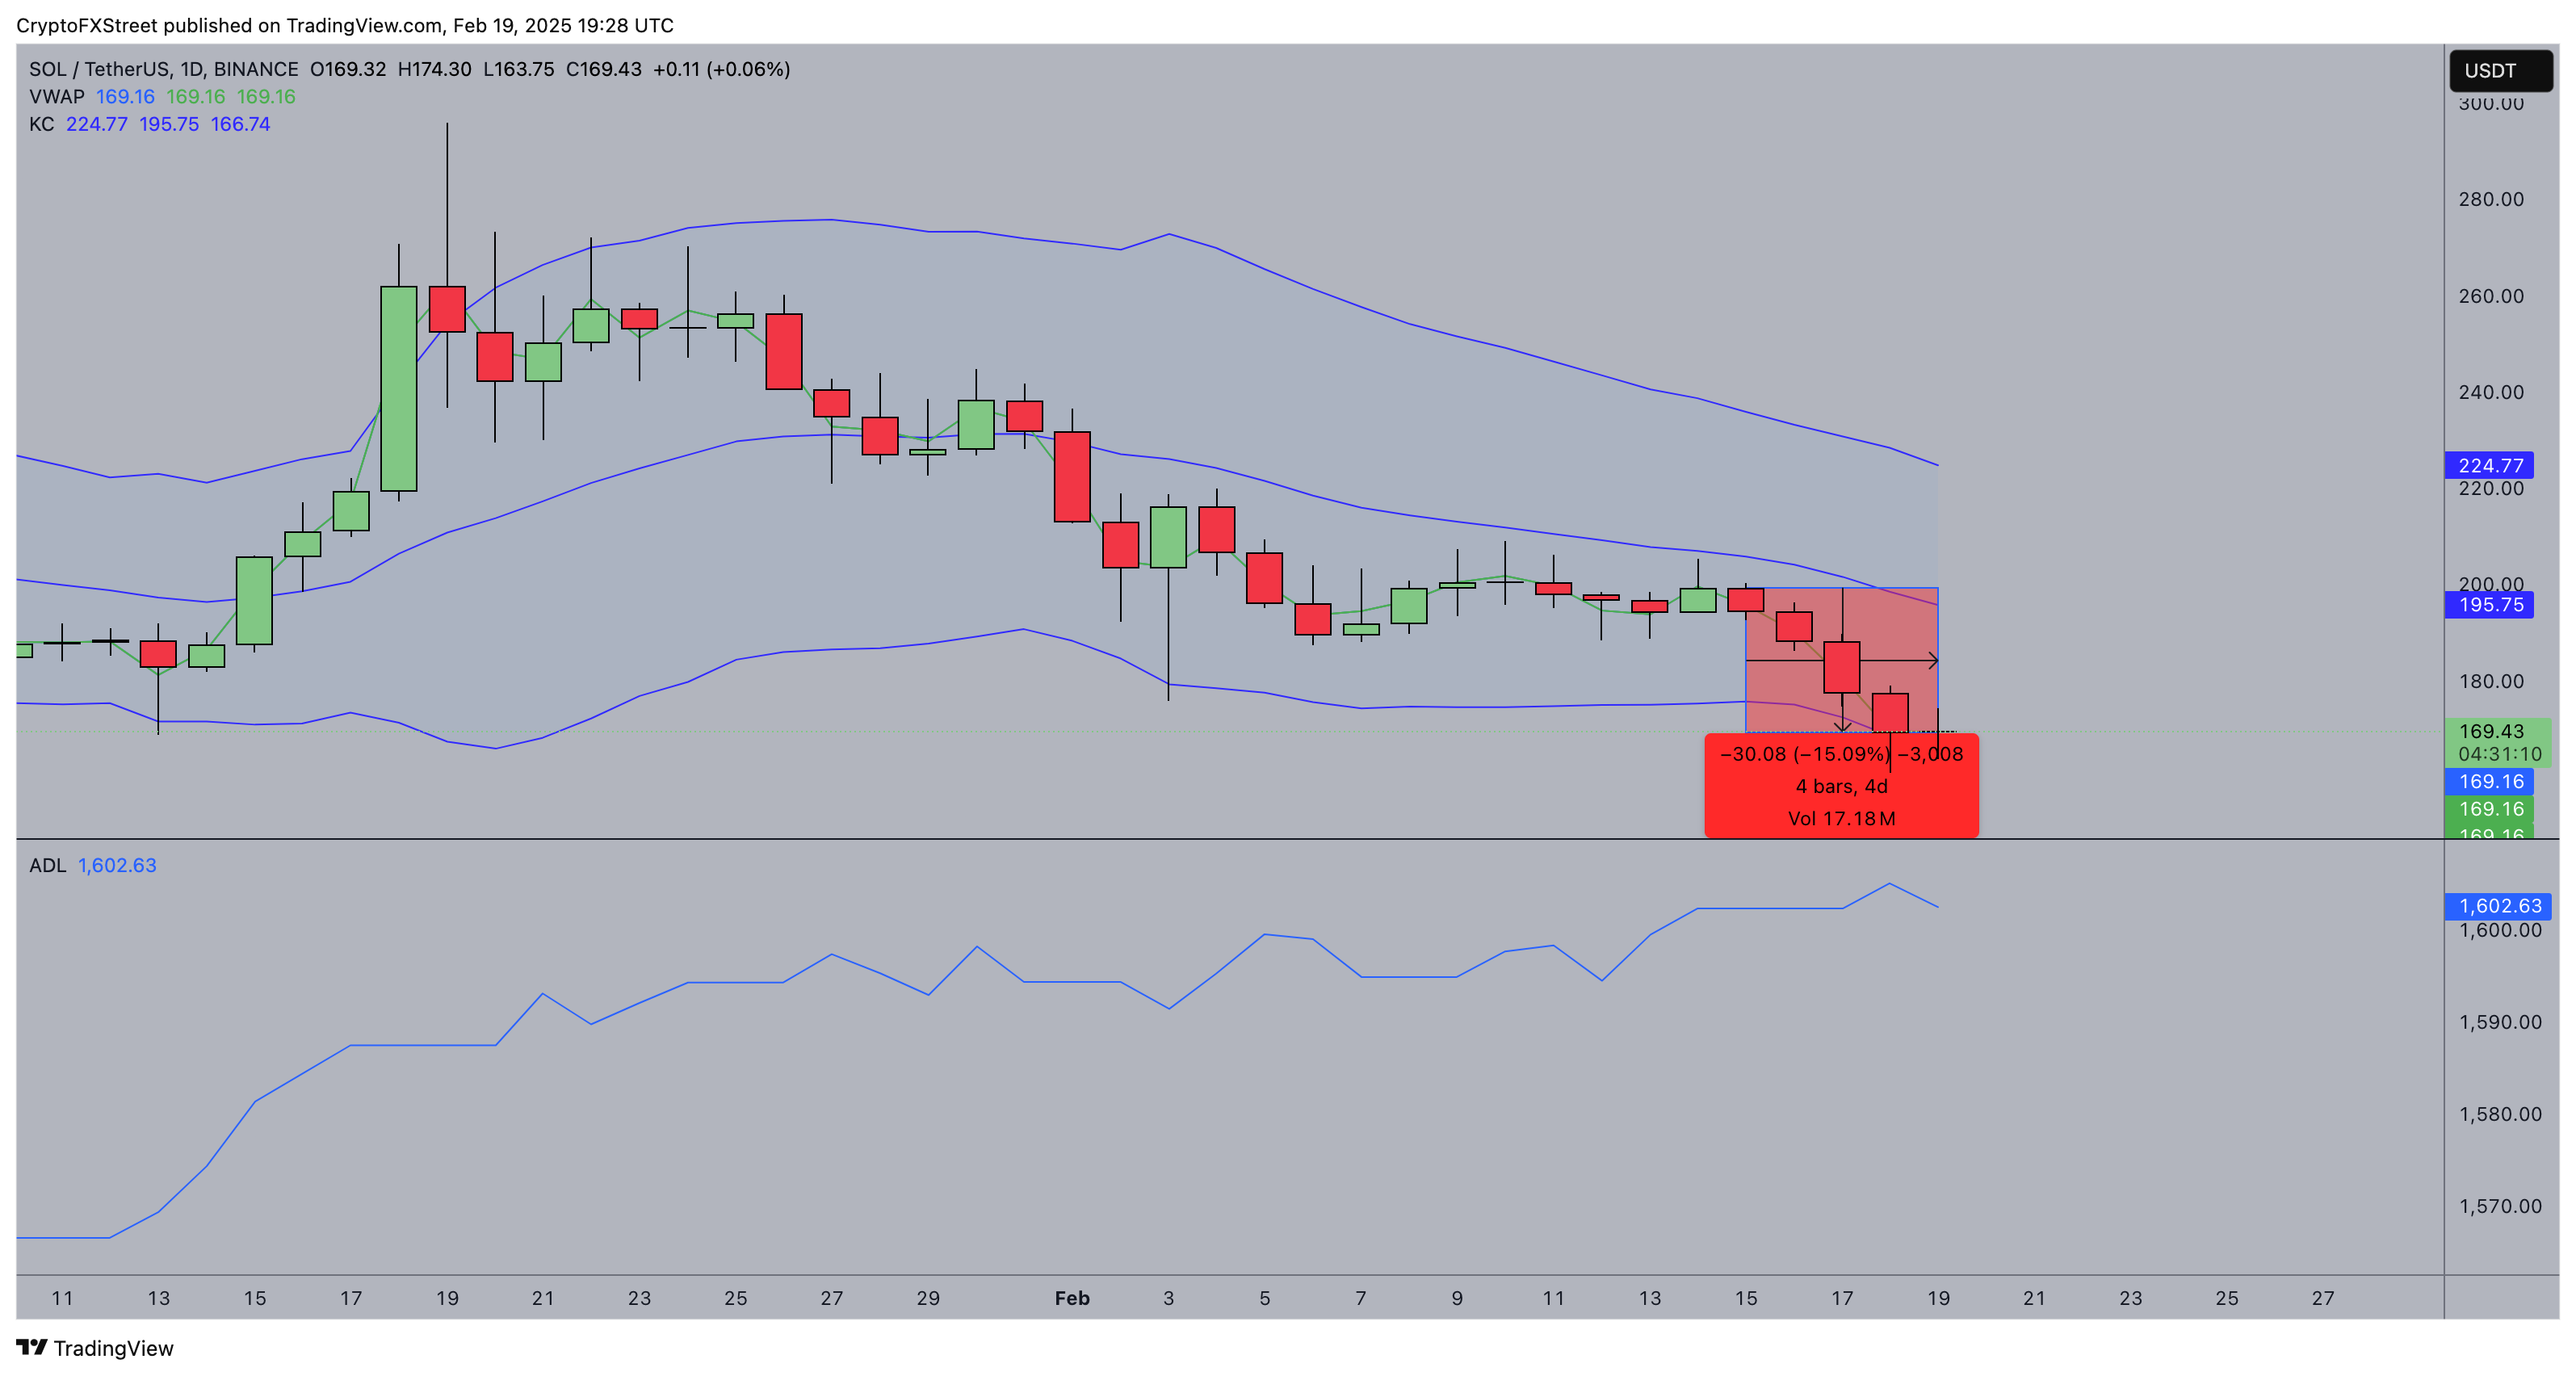
Solana Price Forecast
A multi-day close below $170 could amplify downward pressure, exposing Solana to the $160 support zone, where derivatives data suggests a major liquidity cluster.
More so, the Accumulation/Distribution Line (ADL) has trended lower, confirming declining capital inflows, a sign that bullish sentiment remains muted.
Conversely, a sustained recovery above $172 could encourage buyers to challenge the mid-Keltner level near $195.78.
However, without an uptick in demand, any rebound may prove short-lived, keeping Solana vulnerable to further downside risks
추천 기사


