
US Dollar stuck ahead of Trump’s tariff ‘Liberation Day’
- Traders show no interest in the Greenback, volatility in the DXY tightens.
- US President Trump is set to issue reciprocal tariffs for all countries on Wednesday.
- The US Dollar Index trades stable around 104.10, while looking for any sort of driver.
The US Dollar Index (DXY), which tracks the performance of the US Dollar (USD) against six major currencies, is consolidating further this week with highs and lows coming in closer to one another at the 104.00 round level this Tuesday. Clearly, market participants are not fond of the Greenback at this moment amidst tariff uncertainty. Richmond Federal Reserve (Fed) Bank President Thomas Barkin said the economic reading is wrapped in a thick fog and is unclear for the Fed to read where rates should go, while recession fears are still on the table, CNBC reports.
The economic data releases for this week could get things moving in the runup to the Nonfarm Payrolls data to be published on Friday. For this Tuesday, the US JOLTS Job Openings for February are due, where a substantially lower number could indicate less demand in the labor force because of a slowdown in US consumption. The US Institute for Supply Management (ISM) is due to release its March Manufacturing data.
Daily digest market movers: Data with potential to move markets
- At 13:00 GMT, Richmond Bank Fed President Thomas Barkin is due to speak.
- At 13:45 GMT, the US S&P Global Manufacturing Purchase Managers Index (PMI) data for March will see its final reading. Expectations are for a steady 49.8.
- At 14:00 GMT, a bulk data release is set to take place:
- The US ISM manufacturing data for March:
- The PMI component is expected to fall into contraction at 49.5, coming from 50.3.
- The Prices Paid element is expected to tick up to 65, coming from 62.4.
- New Orders has no forecast and was at 48.6 previously.
- The Employment Index has no survey number and was at 47.6 the last time.
- The US JOLTS Job Openings for February are expected to shrink to 7.63 million job postings against 7.74 million in January.
- The US Economic Optimism Index month-on-month from the TechnoMetrica Institute of Policy and Politics (TIPP) for April is expected to increase to 50.1, coming from 49.8.
- The US ISM manufacturing data for March:
- Equities are all over the place this Tuesday. Asian futures closed off flat on the day, the European ones are rallying near 1.00%. US equities are still making up their mind.
- According to the CME Fedwatch Tool, the probability of interest rates remaining at the current range of 4.25%-4.50% in May’s meeting is 85.5%. For June’s meeting, the odds for borrowing costs being lower stand at 74.4%.
- The US 10-year yield trades around 4.17%, a fresh low for three weeks.
US Dollar Index Technical Analysis: Counting down to ‘Liberation Day’
The US Dollar Index (DXY) sees other asset classes brace for the ‘Liberation Day’ set for Wednesday around 19:00 GMT. The fact that the Greenback is again unfazed by the announcement, while Gold spikes and US Bond yields drop, shows that currency traders are awaiting the impact of Trump’s tariffs on the US economy. There are high hopes that the DXY could finally move higher or lower with this data-filled week.
A return to the 105.00 round level could still occur in the coming days, with the 200-day Simple Moving Average (SMA) converging at that point and reinforcing this area as a strong resistance at 104.93. Once broken through that zone, a string of pivotal levels, such as 105.53 and 105.89, could limit the upward momentum.
On the downside, the 104.00 round level is the first nearby support, although it looks bleak after being tested on Friday and Monday. If that level does not hold, the DXY risks falling back into that March range between 104.00 and 103.00. Once the lower end at 103.00 gives way, watch out for 101.90 on the downside.
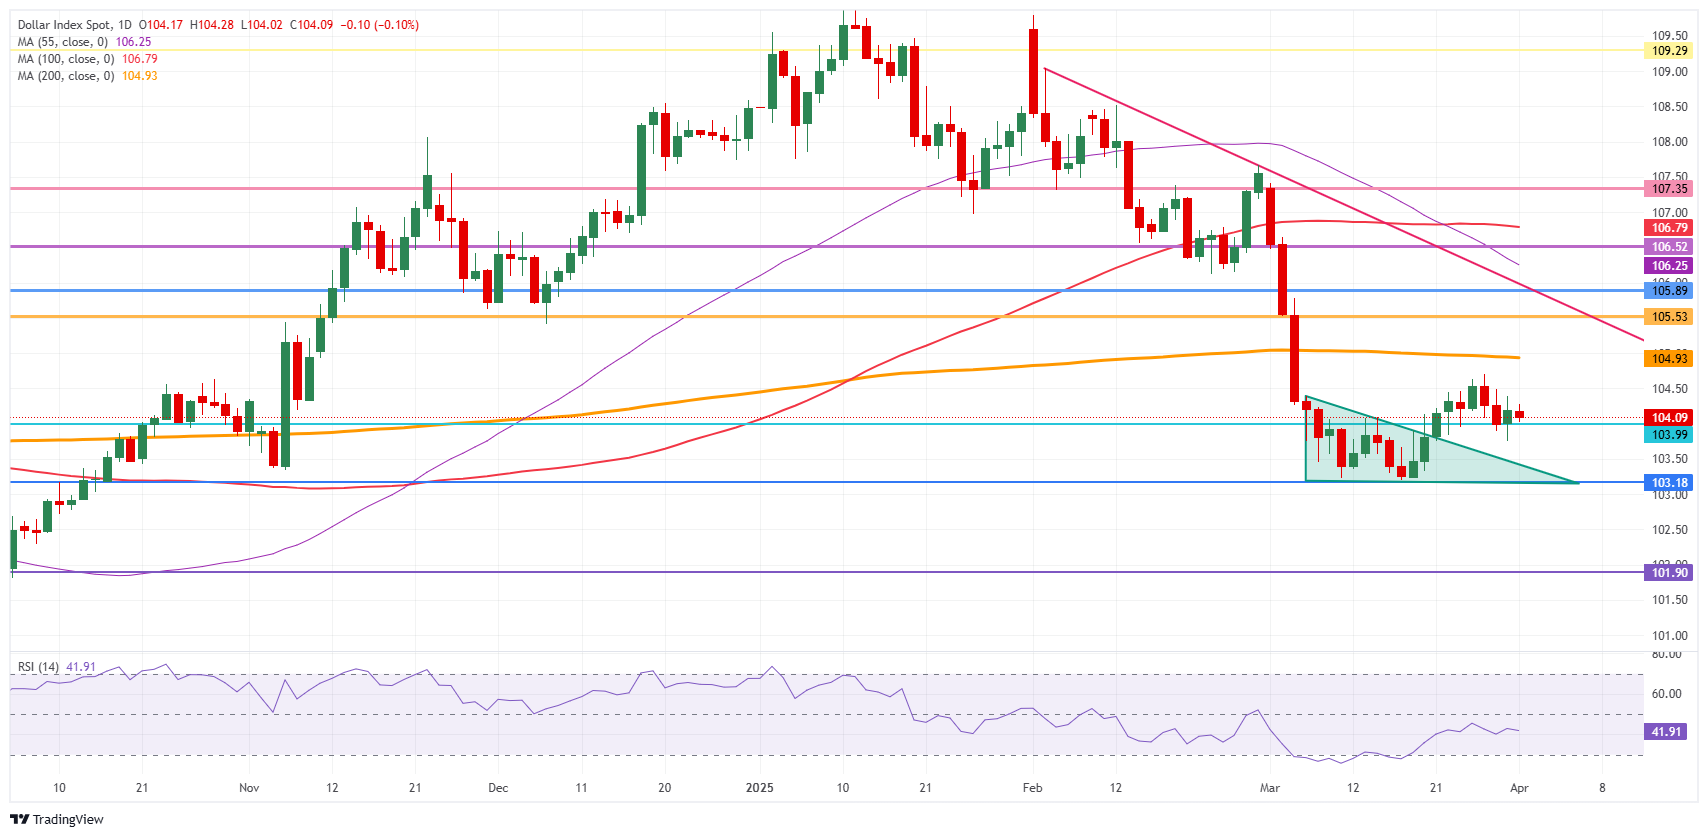
US Dollar Index: Daily Chart
US Dollar FAQs
The US Dollar (USD) is the official currency of the United States of America, and the ‘de facto’ currency of a significant number of other countries where it is found in circulation alongside local notes. It is the most heavily traded currency in the world, accounting for over 88% of all global foreign exchange turnover, or an average of $6.6 trillion in transactions per day, according to data from 2022. Following the second world war, the USD took over from the British Pound as the world’s reserve currency. For most of its history, the US Dollar was backed by Gold, until the Bretton Woods Agreement in 1971 when the Gold Standard went away.
The most important single factor impacting on the value of the US Dollar is monetary policy, which is shaped by the Federal Reserve (Fed). The Fed has two mandates: to achieve price stability (control inflation) and foster full employment. Its primary tool to achieve these two goals is by adjusting interest rates. When prices are rising too quickly and inflation is above the Fed’s 2% target, the Fed will raise rates, which helps the USD value. When inflation falls below 2% or the Unemployment Rate is too high, the Fed may lower interest rates, which weighs on the Greenback.
In extreme situations, the Federal Reserve can also print more Dollars and enact quantitative easing (QE). QE is the process by which the Fed substantially increases the flow of credit in a stuck financial system. It is a non-standard policy measure used when credit has dried up because banks will not lend to each other (out of the fear of counterparty default). It is a last resort when simply lowering interest rates is unlikely to achieve the necessary result. It was the Fed’s weapon of choice to combat the credit crunch that occurred during the Great Financial Crisis in 2008. It involves the Fed printing more Dollars and using them to buy US government bonds predominantly from financial institutions. QE usually leads to a weaker US Dollar.
Quantitative tightening (QT) is the reverse process whereby the Federal Reserve stops buying bonds from financial institutions and does not reinvest the principal from the bonds it holds maturing in new purchases. It is usually positive for the US Dollar.
추천 기사


