
Dow Jones Industrial Average recoils again as risk aversion sets in
- The Dow Jones backslid another 100 points on Thursday.
- Equities are facing further downside as US tariffs weigh on car manufacturing.
- Financial agencies are stepping up their warnings of risks to the US economy.
The Dow Jones Industrial Average (DJIA) headed lower for a second straight day on Thursday, declining another 100 points to fall one-quarter of one percent. The major equity index is testing below 42,400 as investors grapple with a fresh bout of tariff threats from the Trump administration.
United States (US) President Donald Trump has slated a 25% tariff to be imposed on all vehicles imported into the US, to begin on April 2 in tandem with a wide-reaching package of “reciprocal” tariffs across the board. Standard & Poors Global (S&P Global), Fitch Ratings, Moody’s, and the Congressional Budget Office (CBO) all took the opportunity to highlight risk clouds that are beginning to gather over the US economy as the Trump administration pursues an us-vs-everybody trade standoff with all of the US’s trading partners at the same time.
US Gross Domestic Product (GDP) figures for 2024’s fourth quarter came in slightly higher than expected, with the US economy growing by 2.4% on an annualized basis, slightly beating median market forecasts of 2.3%. However any celebrations about US growth were quickly hobbled by the Moody’s ratings agency, who followed up economic warnings earlier this week with a fresh klaxon that higher tariffs and tax cuts will dramatically boost government deficits. According to Moody’s, the financial agency is moving closer to downgrading the quality of US debt, a move that would likely spark a rise in Treasury yields, making US debt even more expensive.
S&P Global warned that US policy uncertainty will hamper global growth outlook, as well as economic prospects across the board. Fitch Ratings noted that US tariffs, if implemented as they currently stand, will have a devastating impact on smaller economies including Brazil, India, and Vietnam, which will make it harder, not easier, for emerging market (EM) economies pivot into being a net purchaser of US goods and services like President Trump wants.
CBO slashed its own US growth forecasts on Thursday, shifting its 2025 GDP forecast to just 1.9%, an annual growth figure the government office doesn’t expect the US to overcome for the foreseeable future, all the way out to 2035, where they see US growth slowing even further. CBO also expects the rate of inflation slowing within the US economy to functionally grind to a halt in 2025. CBO, in line with recent Federal Reserve (Fed) forecasts, now expects the current pace of inflation to remain stubbornly high until some point in 2027.
The CBO also expects US the US budget deficit to soar to 7.3% of GDP in 2025 unless federal agencies make changes to their current plans. According to CBO calculations, US debt servicing including interest payments are expected to take up 5.4% of annual US GDP by 2055 unless changes are made.
Stock news
Equity indexes are facing downside pressure on Thursday, however losses remain limited vehicle manufacturers exposed to planned Trump administration tariffs on all foreign-produced vehicles. According to rough estimates, nearly 40% of every single vehicle on US roads is manufactured or produced by foreign companies. As investors dig in their heels and hope for good signs soon. The Dow Jones is down roughly one-quarter of one percent, with the S&P 500 and Nasdaq Composite both trading within one-tenth of one percent from the day’s opening bids.
Read more stock news: Nvidia drops below $111 despite product lead on AMD
Dow Jones price forecast
The Dow Jones continues to test back into the 200-day Exponential Moving Average (EMA) near 42,000 as long-term bullish momentum bleeds out of the charts. Bidding action remains capped by the 50-day EMA just below the 43,000 price handle, and the Dow Jones’ recent bullish recovery appears to be over and geared to price in its first lower-high pattern in almost two years.
Dow Jones daily chart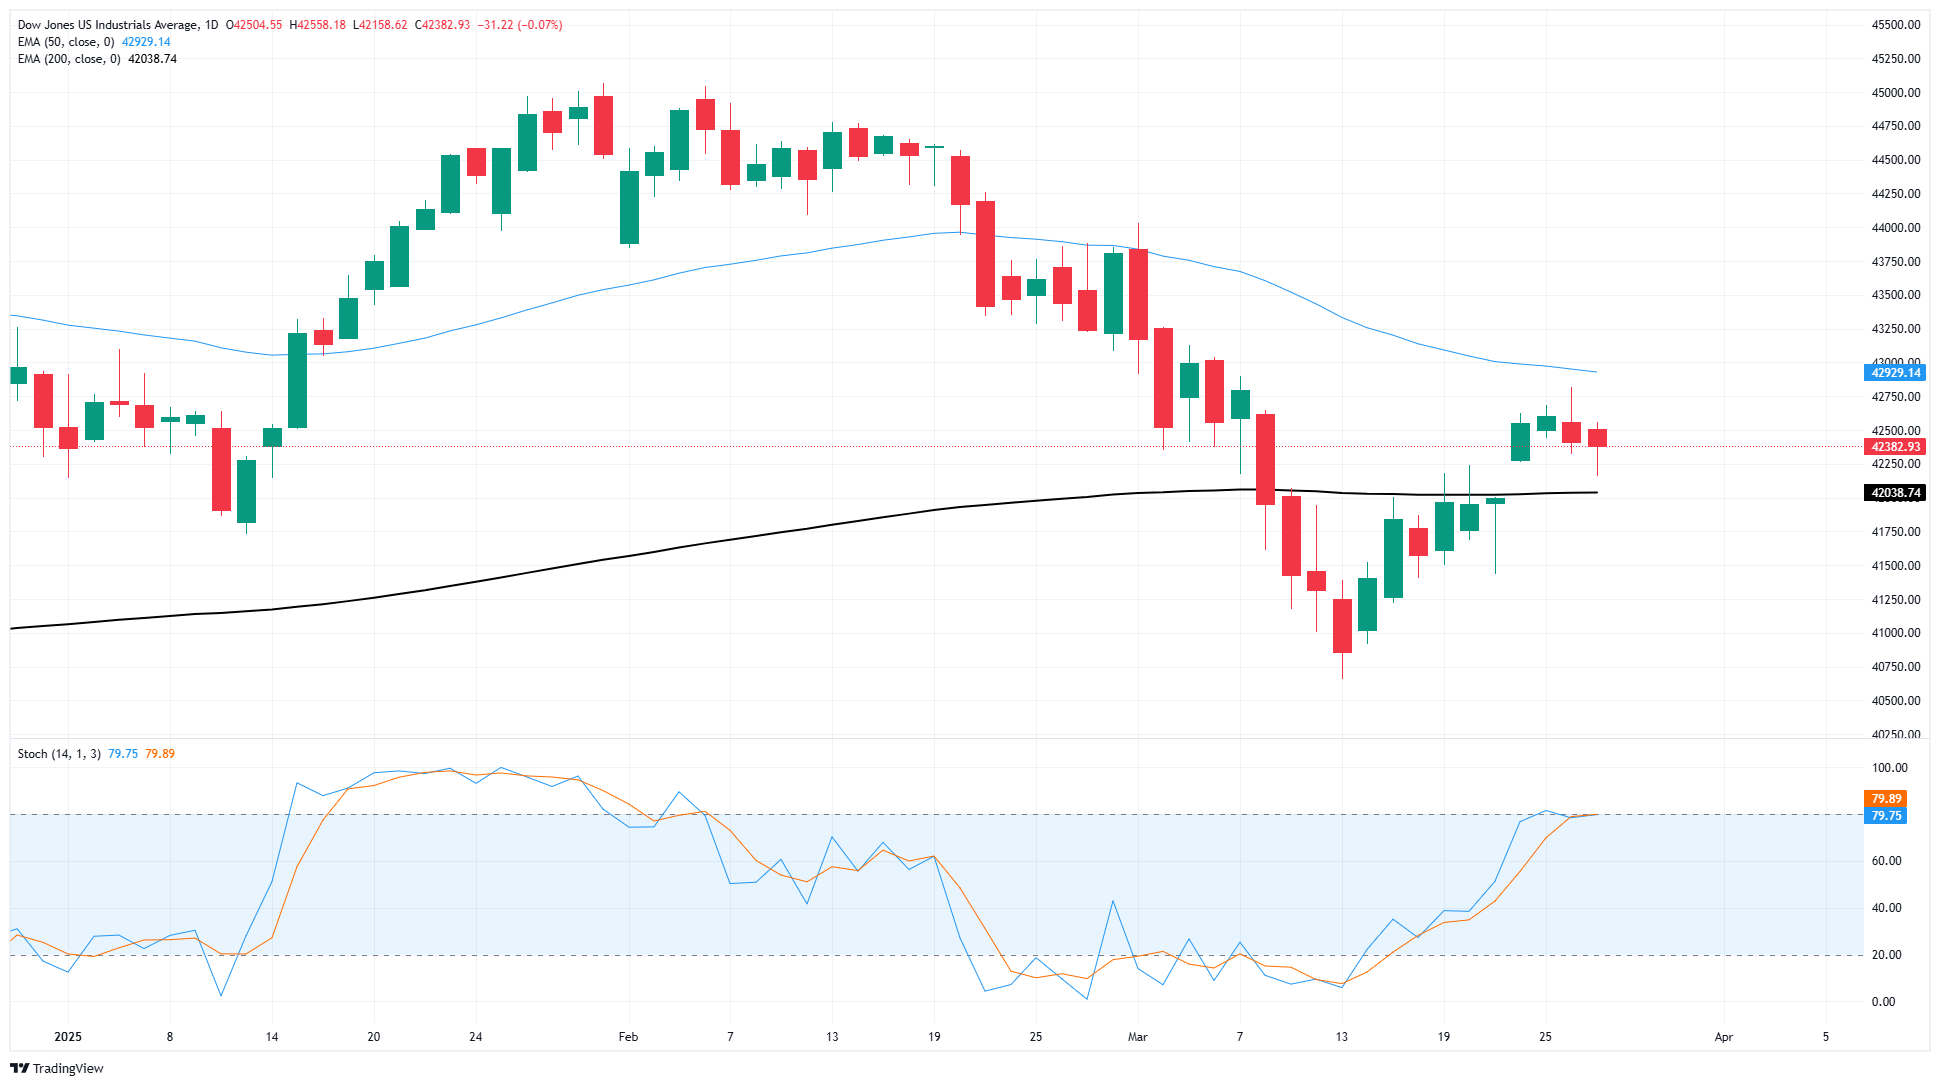
Dow Jones FAQs
The Dow Jones Industrial Average, one of the oldest stock market indices in the world, is compiled of the 30 most traded stocks in the US. The index is price-weighted rather than weighted by capitalization. It is calculated by summing the prices of the constituent stocks and dividing them by a factor, currently 0.152. The index was founded by Charles Dow, who also founded the Wall Street Journal. In later years it has been criticized for not being broadly representative enough because it only tracks 30 conglomerates, unlike broader indices such as the S&P 500.
Many different factors drive the Dow Jones Industrial Average (DJIA). The aggregate performance of the component companies revealed in quarterly company earnings reports is the main one. US and global macroeconomic data also contributes as it impacts on investor sentiment. The level of interest rates, set by the Federal Reserve (Fed), also influences the DJIA as it affects the cost of credit, on which many corporations are heavily reliant. Therefore, inflation can be a major driver as well as other metrics which impact the Fed decisions.
Dow Theory is a method for identifying the primary trend of the stock market developed by Charles Dow. A key step is to compare the direction of the Dow Jones Industrial Average (DJIA) and the Dow Jones Transportation Average (DJTA) and only follow trends where both are moving in the same direction. Volume is a confirmatory criteria. The theory uses elements of peak and trough analysis. Dow’s theory posits three trend phases: accumulation, when smart money starts buying or selling; public participation, when the wider public joins in; and distribution, when the smart money exits.
There are a number of ways to trade the DJIA. One is to use ETFs which allow investors to trade the DJIA as a single security, rather than having to buy shares in all 30 constituent companies. A leading example is the SPDR Dow Jones Industrial Average ETF (DIA). DJIA futures contracts enable traders to speculate on the future value of the index and Options provide the right, but not the obligation, to buy or sell the index at a predetermined price in the future. Mutual funds enable investors to buy a share of a diversified portfolio of DJIA stocks thus providing exposure to the overall index.
추천 기사


