


US Dollar hits a fresh four-month low on German spending deal optimism
- The US Dollar trades broadly in the red on Tuesday, devaluing further against most major peers.
- The German Green coalition is said to be back on track for a defense spending bill.
- The US Dollar Index heads to the lower range of 103.00 and could break below it.
The US Dollar Index (DXY), which tracks the performance of the US Dollar (USD) against six major currencies, is eking out lows not seen since October 2024. The index trades above 103.50 at the time of writing on Tuesday. The Greenback faces headwinds on early European comments from the German green coalition, who said to be back on track for an agreement on a German defense spending bill. This pushes the US Dollar (USD) lower in favor of the Euro (EUR).
On the economic data front, the US JOLTS Job Openings report for January will catch most of the attention. Traders are already spooked by recession fears, so a further decline in job openings could add to that conviction and see further downside momentum for the DXY. The US NFIB Business Optimism Index for February already released fell to 100.7, missing the 101 estimate and further down from the previous 102.8 reading.
Daily digest market movers: Some dots to connect
- In the early European trading session, a headline was published that the German Green coalition leader said to be hopeful on a defense spending deal this week, Bloomberg reported. This news represents a 180-degree shift from the headline that triggered some US Dollar (USD) strength on Monday, where the Green Party was unwilling to support any defense spending deal.
- At 14:00, the US JOLTS Job Openings report for January will be published. Expectations are for an uptick to 7.75 million openings against the 7.6 million from December.
- Equities are trying to brush off the doom and gloom from Monday. European equities are higher while US futures are in positive territory.
- The CME Fedwatch Tool projects a 95.0% chance for no interest rate changes in the upcoming Fed meeting on March 19. However, the chances of a rate cut at the May 7 meeting increase to 47.8% and to 89.9% at June’s meeting.
- The US 10-year yield trades around 4.20%, off its near five-month low of 4.10% printed on Tuesday last week.
US Dollar Index Technical Analysis: Not a one-day event
The US Dollar Index (DXY) faces more selling pressure on Tuesday as recession fears are not going away. Traders remain concerned about tariffs’ impact and uncertainty on the US economy. Seeing the performance in US equities year-to-date, there is not much reason to be happy and no reason to support a stronger Dollar in the current narrative.
There is an upside risk at 104.00 for a firm rejection. If bulls can avoid that, look for a large sprint higher towards the 105.00 round level, with the 200-day Simple Moving Average (SMA) at 105.03. Once broken through that zone, a string of pivotal levels, such as 105.53 and 105.89, will present as caps.
On the downside, the 103.00 round level could be considered a bearish target in case US yields roll off again, with even 101.90 not unthinkable if markets further capitulate on their long-term US Dollar holdings.
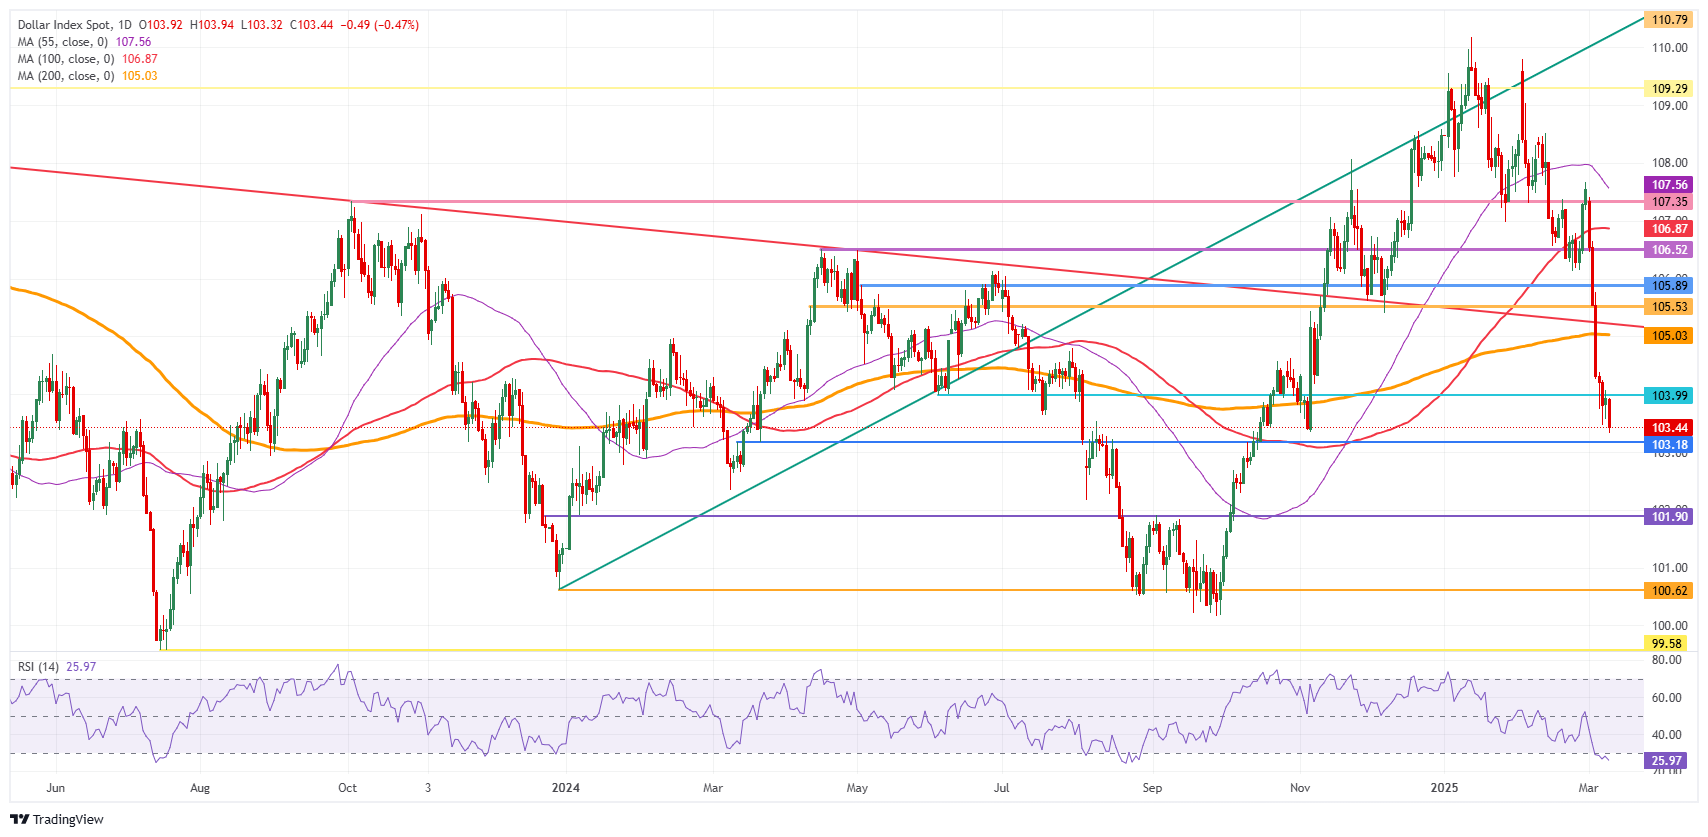
US Dollar Index: Daily Chart
US-China Trade War FAQs
Generally speaking, a trade war is an economic conflict between two or more countries due to extreme protectionism on one end. It implies the creation of trade barriers, such as tariffs, which result in counter-barriers, escalating import costs, and hence the cost of living.
An economic conflict between the United States (US) and China began early in 2018, when President Donald Trump set trade barriers on China, claiming unfair commercial practices and intellectual property theft from the Asian giant. China took retaliatory action, imposing tariffs on multiple US goods, such as automobiles and soybeans. Tensions escalated until the two countries signed the US-China Phase One trade deal in January 2020. The agreement required structural reforms and other changes to China’s economic and trade regime and pretended to restore stability and trust between the two nations. However, the Coronavirus pandemic took the focus out of the conflict. Yet, it is worth mentioning that President Joe Biden, who took office after Trump, kept tariffs in place and even added some additional levies.
The return of Donald Trump to the White House as the 47th US President has sparked a fresh wave of tensions between the two countries. During the 2024 election campaign, Trump pledged to impose 60% tariffs on China once he returned to office, which he did on January 20, 2025. With Trump back, the US-China trade war is meant to resume where it was left, with tit-for-tat policies affecting the global economic landscape amid disruptions in global supply chains, resulting in a reduction in spending, particularly investment, and directly feeding into the Consumer Price Index inflation.
추천 기사


