
US Dollar correction continues with DXY Index at four-month low
- The US Dollar drops against most major peers for a third day in a row.
- Traders are selling the US Dollar in favor of the Euro amid economic developments in the US.
- The US Dollar Index DXY faces over 2% devaluation so far this week.
The US Dollar Index (DXY), which tracks the performance of the US Dollar (USD) against six major currencies, extends its decline for the third day in a row this week and trades near 105.00 at the time of writing on Wednesday, the lowest level since early November. The downward move comes as traders further unwind their overall Dollar exposure now that several analysts are calling the end of the United States (US) exceptionalism amid concerns that US President Donald Trump’s tariffs could damage economic growth. The move comes ahead of the European Central Bank (ECB) rate decision on Thursday and the US Nonfarm Payrolls report for February on Friday.
On the economic data front, more negativeness for the US Dollar could be on the horizon. The Institute for Supply Management (ISM) is set to release its report on the Services sector on Wednesday. At the start of the week on Monday, the ISM report on the Manufacturing sector set in motion the correction in the Greenback, which only accelerated further since then.
Daily digest market movers: Services sector to save the day?
- At 13:15 GMT, the usual appetizer ahead of the Nonfarm Payrolls is due with the ADP Employment Change number for February. Expectations are for 140,000 new employees in the private sector, below the 183,000 in January.
- At 14:45 GMT, S&P Global will release its final reading for the Purchasing Managers Index (PMI) on the Services sector. Expectations are for a steady 49.7.
- At 15:00 GMT, the ISM is ready to release its PMI report on the Services sector for February:
- Services PMI is expected to come in at 52.6, a touch softer than the previous 52.8.
- The economic calendar does not show expectations regarding the Employment component, which was 52.3 in January.
- The New Orders component has no consensus view and was at 51.3 previously.
- At 18:00 GMT, Federal Reserve Bank of Richmond President Thomas Barkin delivers a speech titled "Inflation Then and Now" at the Fredericksburg Regional Alliance in Fredericksburg, United States.
- At 19:00 GMT, the Federal Reserve will release the Beige Book, which reports on the current US economic situation.
- Equities are on the rebound, with green spurts across the board from Asia over Europe and into the US futures.
- The CME Fedwatch Tool projects a 21.0% chance that interest rates will remain at the current range of 4.25%-4.50% in June, with the rest showing a possible rate cut.
- The US 10-year yield trades around 4.26%, off its near five-month low of 4.10% printed on Tuesday.
US Dollar Index Technical Analysis: DXY not a fan of tariffs
The US Dollar Index (DXY) is not enjoying this week, that is for sure. The DXY sees bulls exiting the premises, which gives the US Dollar bears good cards to run the Greenback into the ground. With more and more calls for lower US rates while US economic data further deteriorates, it looks like the DXY might be on its way even to 103.00 in the near term if this selling pressure keeps persisting.
On the upside, the first upside target to recover is the pivotal level at 105.53. Once through there, a heavy job awaits with pivotal levels at 105.89 and 106.52 before bulls start to consider a visit to the 100-day Simple Moving Average (SMA) at 106.87.
On the downside, the 200-day SMA at 105.03 is identified as the first support level, which is being tested at the time of writing. Should that level snap, a long stretch opens up towards 104.00. Even 103.00 could come under consideration in case US yields roll off further.
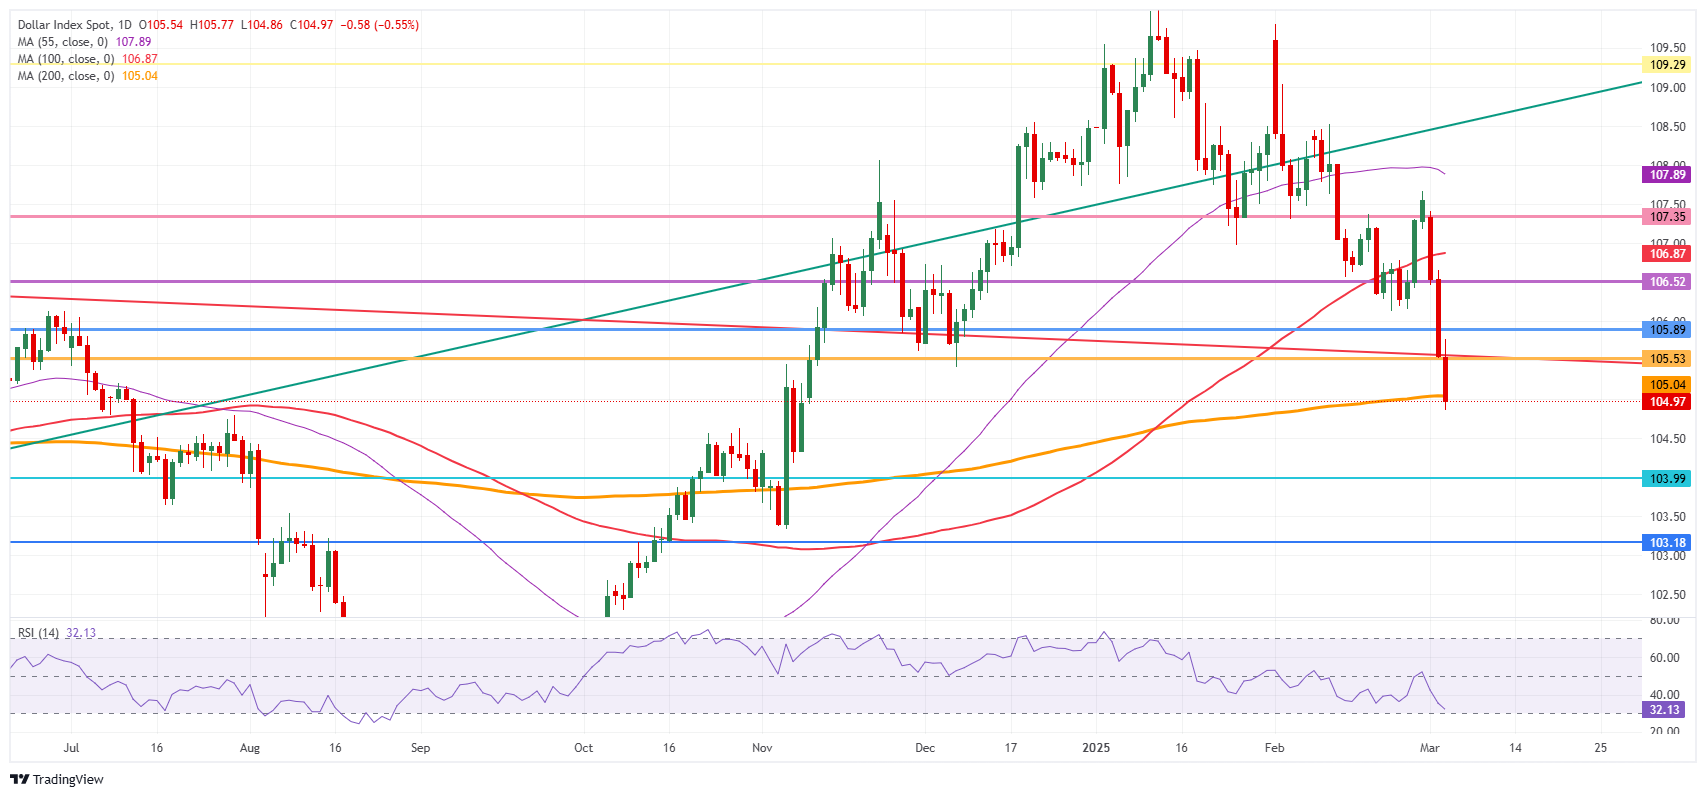
US Dollar Index: Daily Chart
US-China Trade War FAQs
Generally speaking, a trade war is an economic conflict between two or more countries due to extreme protectionism on one end. It implies the creation of trade barriers, such as tariffs, which result in counter-barriers, escalating import costs, and hence the cost of living.
An economic conflict between the United States (US) and China began early in 2018, when President Donald Trump set trade barriers on China, claiming unfair commercial practices and intellectual property theft from the Asian giant. China took retaliatory action, imposing tariffs on multiple US goods, such as automobiles and soybeans. Tensions escalated until the two countries signed the US-China Phase One trade deal in January 2020. The agreement required structural reforms and other changes to China’s economic and trade regime and pretended to restore stability and trust between the two nations. However, the Coronavirus pandemic took the focus out of the conflict. Yet, it is worth mentioning that President Joe Biden, who took office after Trump, kept tariffs in place and even added some additional levies.
The return of Donald Trump to the White House as the 47th US President has sparked a fresh wave of tensions between the two countries. During the 2024 election campaign, Trump pledged to impose 60% tariffs on China once he returned to office, which he did on January 20, 2025. With Trump back, the US-China trade war is meant to resume where it was left, with tit-for-tat policies affecting the global economic landscape amid disruptions in global supply chains, resulting in a reduction in spending, particularly investment, and directly feeding into the Consumer Price Index inflation.
추천 기사


