
US Dollar extends correction as global trade war fears ease
- The US Dollar slides lower against most major peers and looks for support on Wednesday.
- Economic data and risk premium unwind in the Greenback is triggering a correction.
- The US Dollar Index (DXY) falls below 108.00 and tests major support at 107.50.
The US Dollar Index (DXY), which tracks the performance of the US Dollar against six major currencies, dives lower and trades near 107.50 at the time of writing on Wednesday ahead of the US Purchase Managers Index (PMI) releases from both S&P Global and the Institute for Supply Management (ISM). Tensions in markets over the United States (US) President Donald Trump’s tariffs are unwinding now that levies on Mexico and Canada slapped over the weekend have been paused. This coincides with some US Dollar (USD) risk premium easing this Wednesday while Chinese traders head back to their desks after the Chinese New Year, with a surge in trading volumes.
As mentioned above, the economic data calendar shows a bulk of PMI releases on Wednesday. In Europe, the aggregate Eurozone, German, French, and Spanish PMI data have already been released earlier in the day, with final readings for January falling roughly in line to below their preliminary readings. In the US, S&P Global is set to release its reading in the early American session, with the ISM data specifically for the Services sector set to be issued just minutes thereafter.
Daily digest market movers: Data takes over from tariffs
- At 13:15 GMT, the ADP Employment Change for the private sector will be released. Expectations are for an increase of 150,000 new jobs in January compared to 122,000 previously.
- At 14:45 GMT, S&P Global will release its final reading for the Services and Composite PMI for January. No changes are expected from preliminary readings, with Services standing at 52.8 and the Composite at 52.4.
- At 15:00 GMT, the ISM will release its January reading for the Services sector:
- Services PMI is expected to tick up to 54.3 from 54.1 in December.
- The Prices Paid component has no forecast and was at 64.4 in the previous release.
- At 18:00 GMT, Chicago Fed President Austan Goolsbee delivers a speech on the current economy at the Chicago Fed's 31st Annual Automotive Insights Symposium, held at the Bank's Detroit Branch.
- Near 20:00 GMT, Federal Reserve Governor Michelle Bowman delivers a speech on Brief Economic Update and Bank Regulation at the 2025 Kansas Bankers Association Harold A. Stones Government Relations Conference.
- Equities are in deep red numbers, with Chinese traders returning to markets after the Chinese New Year holidays and having a lot to catch up with. Where losses in Europe are still contained, US futures are seeing the Nasdaq down by 1%.
- The CME FedWatch tool projects an 83.5% chance of the Fed keeping interest rates unchanged in the next meeting on March 19.
- The US 10-year yield is trading around 4.474%, just a sigh away from its yearly low of 4.46% seen on Monday.
- Gold hits another fresh all-time high above $2,875, with investors fleeing equities and bonds, heading into bullion.
US Dollar Index Technical Analysis: Safe haven excludes Dollar
The US Dollar Index (DXY) extends correction and dives lower on Wednesday. Traders and investors are heading to safe havens like Gold and the Swiss Franc (CHF). For once, the Greenback is not part of the rescue party, as risk-premium gained at the beginning of the week after President Trump slapped Mexico and Canada with tariffs over the weekend is starting to ease, no longer supporting an elevated US Dollar.
On the upside, the first barrier at 109.30 (July 14, 2022, high and rising trendline) was briefly surpassed but did not hold on Monday. Once that level is reclaimed, the next level to hit before advancing further remains at 110.79 (September 7, 2022, high).
On the downside, the October 3, 2023, high at 107.35 acts is trying to hold support and withstand the selling pressure this Wednesday. For now, that looks to be holding, though the Relative Strength Index (RSI) still has some room for the downside. Hence, look for 106.52 or even 105.89 as better levels.
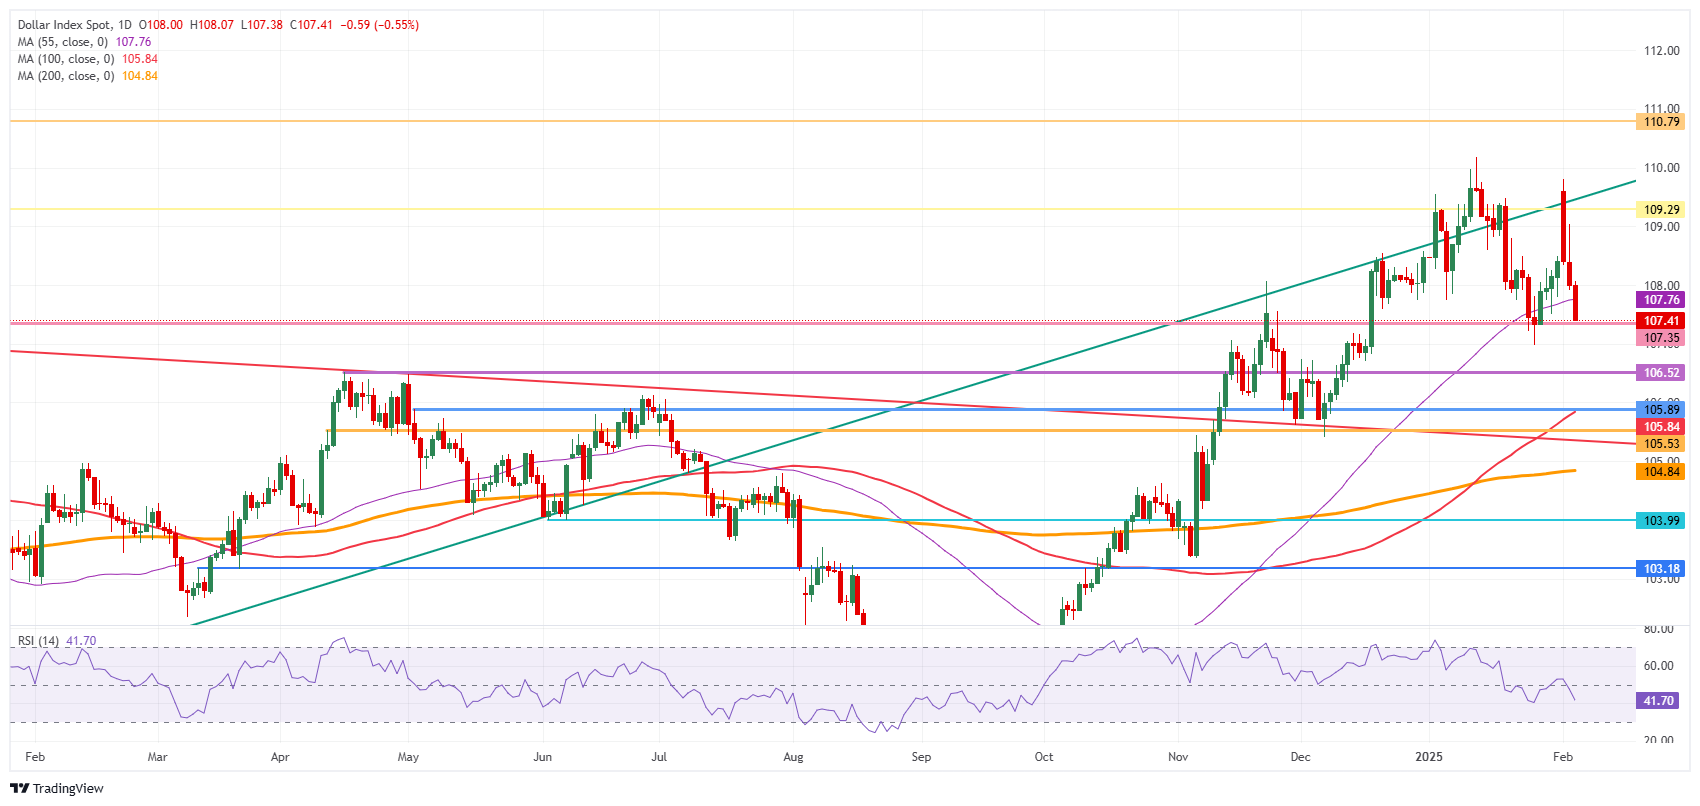
US Dollar Index: Daily Chart
US-China Trade War FAQs
Generally speaking, a trade war is an economic conflict between two or more countries due to extreme protectionism on one end. It implies the creation of trade barriers, such as tariffs, which result in counter-barriers, escalating import costs, and hence the cost of living.
An economic conflict between the United States (US) and China began early in 2018, when President Donald Trump set trade barriers on China, claiming unfair commercial practices and intellectual property theft from the Asian giant. China took retaliatory action, imposing tariffs on multiple US goods, such as automobiles and soybeans. Tensions escalated until the two countries signed the US-China Phase One trade deal in January 2020. The agreement required structural reforms and other changes to China’s economic and trade regime and pretended to restore stability and trust between the two nations. However, the Coronavirus pandemic took the focus out of the conflict. Yet, it is worth mentioning that President Joe Biden, who took office after Trump, kept tariffs in place and even added some additional levies.
The return of Donald Trump to the White House as the 47th US President has sparked a fresh wave of tensions between the two countries. During the 2024 election campaign, Trump pledged to impose 60% tariffs on China once he returned to office, which he did on January 20, 2025. With Trump back, the US-China trade war is meant to resume where it was left, with tit-for-tat policies affecting the global economic landscape amid disruptions in global supply chains, resulting in a reduction in spending, particularly investment, and directly feeding into the Consumer Price Index inflation.
추천 기사


