US Dollar Index Price Forecast: Sits near two-year peak, above 109.00 ahead of US NFP
- DXY consolidates its recent move up back closer to a two-year peak amid the Fed’s hawkish shift.
- Geopolitical risks and trade war fears further underpin demand for the safe-haven Greenback.
- The USD bulls turn cautious and wait for the release of the US NFP report before placing fresh bets.
The US Dollar Index (DXY), which tracks the Greenback against a basket of currencies, stands firm above the 109.00 mark, or its highest level since November 2022 as traders await the US Nonfarm Payrolls (NFP) report before placing fresh bets.
In the meantime, the prospects for slower rate cuts by the Federal Reserve (Fed), which has been a key factor behind the recent surge in the US Treasury bond yields, continue to act as a tailwind for the buck. Apart from this, concerns about US President-elect Donald Trump's tariff plans, geopolitical risks and a weaker risk tone turn out to be other factors underpinning the safe-haven Greenback.
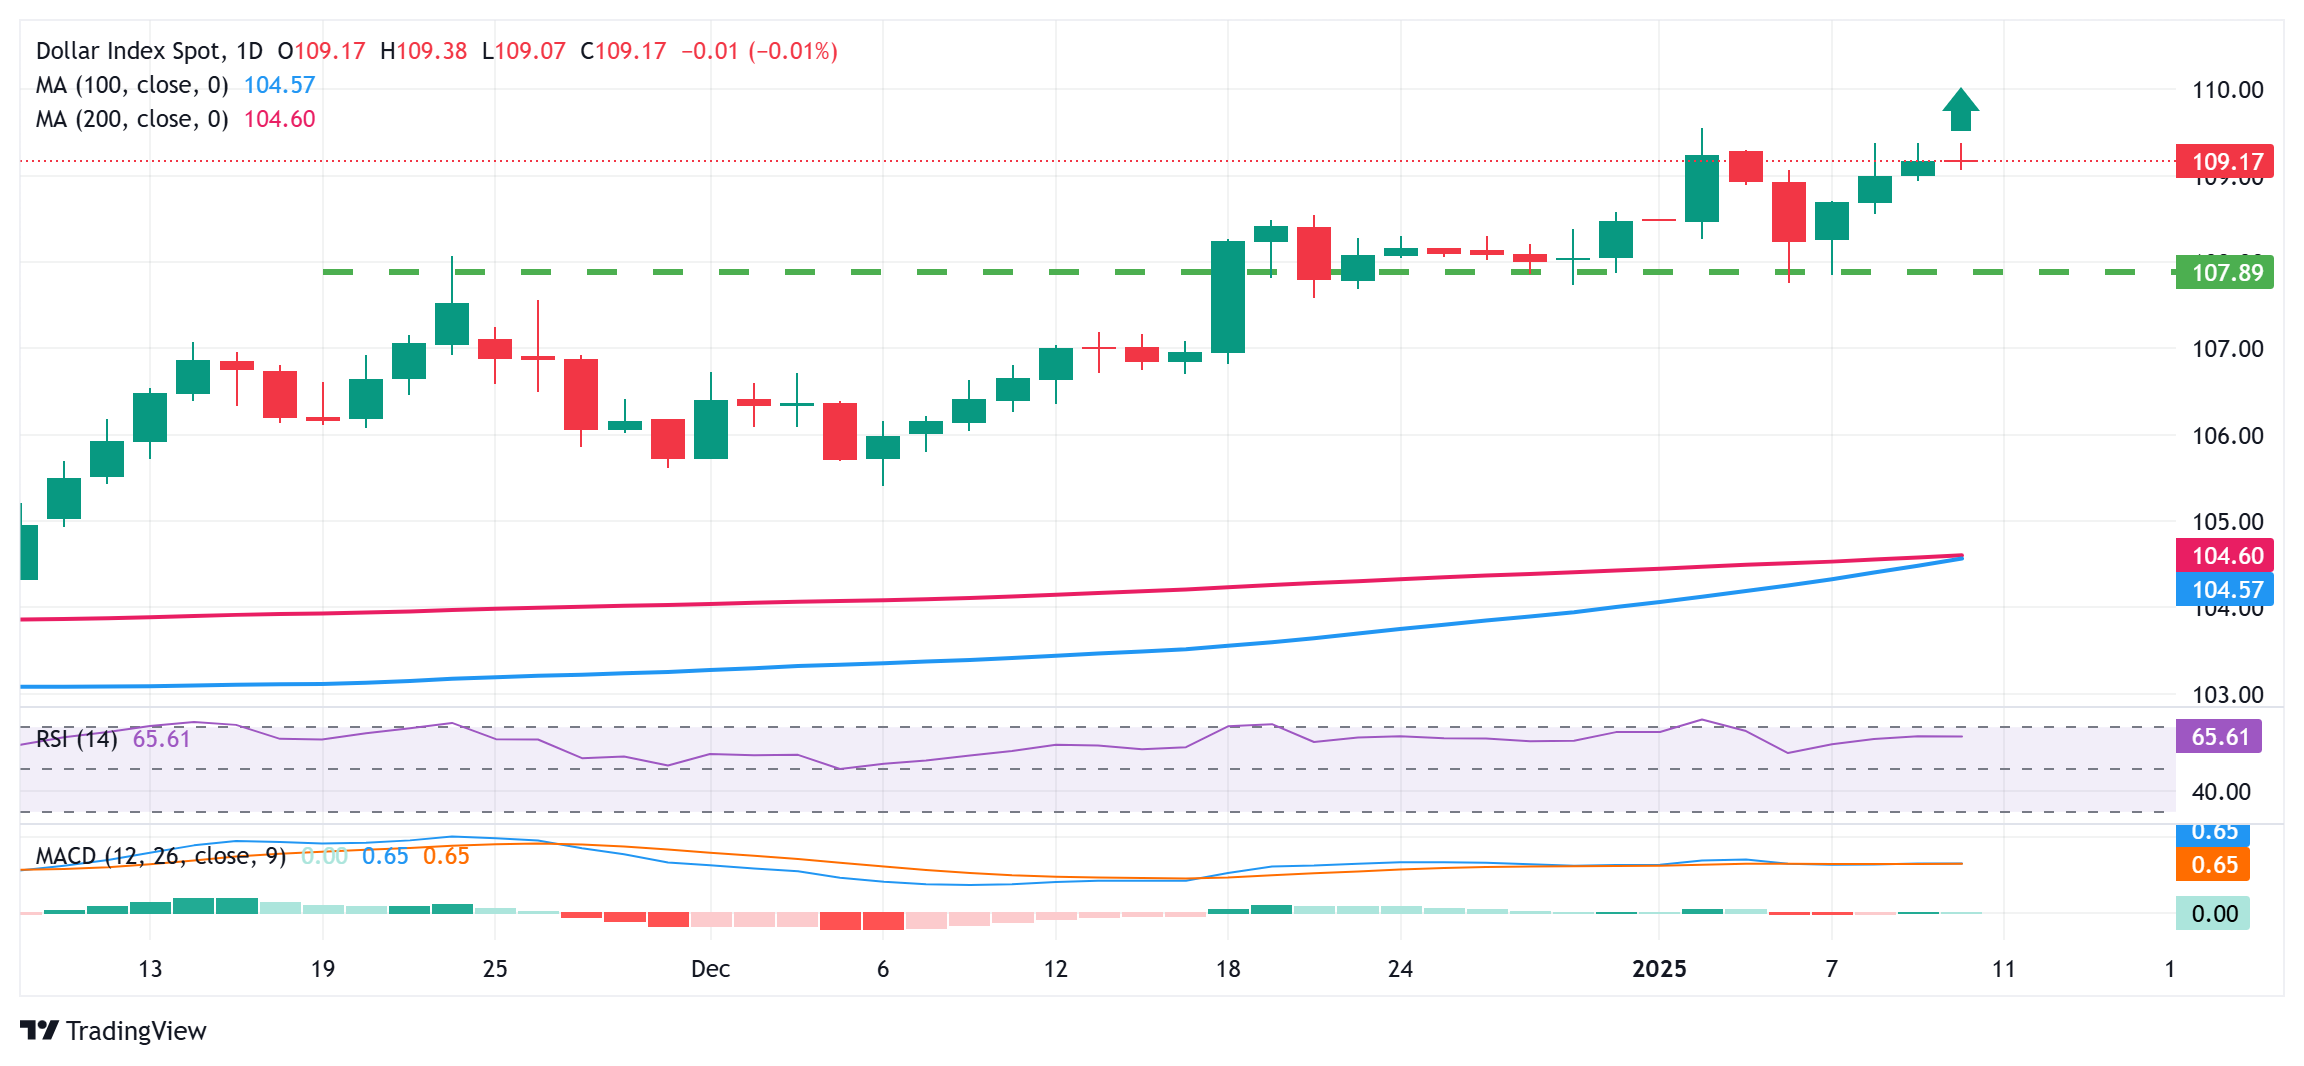
From a technical perspective, this week's goodish rebound from the 107.55-107.50 resistance-turned-support and the subsequent move up favors bullish traders. Moreover, oscillators on the daily chart are holding in positive territory and are still away from being in the overbought zone. This suggests that the path of least resistance for the index is to the upside and supports prospects for further gains.
That said, it will still be prudent to wait for a move beyond the 109.55 area, or over a two-year peak touched earlier this month, before placing fresh bullish bets. The USD might then accelerate the move-up towards the 110.00 psychological mark. The momentum could extend further towards the 110.50-110.55 region en route to the 111.00 mark and the November 2022 peak, around the 111.15 zone.
On the flip side, the 108.75 region could offer some support, below which the index could accelerate the fall towards the 108.15 area en route to the 108.00 mark and the 107.55 horizontal zone. Some follow-through selling below the latter should pave the way for a deeper corrective decline and drag the USD below the 107.00 round figure, towards testing the next relevant support near mid-106.00s.
DXY daily chart

US Dollar FAQs
The US Dollar (USD) is the official currency of the United States of America, and the ‘de facto’ currency of a significant number of other countries where it is found in circulation alongside local notes. It is the most heavily traded currency in the world, accounting for over 88% of all global foreign exchange turnover, or an average of $6.6 trillion in transactions per day, according to data from 2022. Following the second world war, the USD took over from the British Pound as the world’s reserve currency. For most of its history, the US Dollar was backed by Gold, until the Bretton Woods Agreement in 1971 when the Gold Standard went away.
The most important single factor impacting on the value of the US Dollar is monetary policy, which is shaped by the Federal Reserve (Fed). The Fed has two mandates: to achieve price stability (control inflation) and foster full employment. Its primary tool to achieve these two goals is by adjusting interest rates. When prices are rising too quickly and inflation is above the Fed’s 2% target, the Fed will raise rates, which helps the USD value. When inflation falls below 2% or the Unemployment Rate is too high, the Fed may lower interest rates, which weighs on the Greenback.
In extreme situations, the Federal Reserve can also print more Dollars and enact quantitative easing (QE). QE is the process by which the Fed substantially increases the flow of credit in a stuck financial system. It is a non-standard policy measure used when credit has dried up because banks will not lend to each other (out of the fear of counterparty default). It is a last resort when simply lowering interest rates is unlikely to achieve the necessary result. It was the Fed’s weapon of choice to combat the credit crunch that occurred during the Great Financial Crisis in 2008. It involves the Fed printing more Dollars and using them to buy US government bonds predominantly from financial institutions. QE usually leads to a weaker US Dollar.
Quantitative tightening (QT) is the reverse process whereby the Federal Reserve stops buying bonds from financial institutions and does not reinvest the principal from the bonds it holds maturing in new purchases. It is usually positive for the US Dollar.

