
US Dollar retreats after touching two-year high on hawkish Fed
- The US Dollar retreats from a two-year high, a rally that was driven by the Fed signaling fewer interest-rate cuts ahead.
- The Fed’s dot plot shows concerns on more sticky inflation throughout 2025.
- The US Dollar Index (DXY) is trading around 108.00, in search of nearby support.
The US Dollar (USD) is facing some quick profit-taking on Thursday, with the DXY Index hovering at around 108.00, after its sizable upward move on Wednesday on the back of the Federal Reserve (Fed) interest-rate decision. The rate cut by 25 basis points, lowering the policy rate to the 4.50%-4.75% range, was already long priced in. Markets got spooked by the retreat in the number of projected rate cuts for 2025 from four to only two.
It appears that members of the Federal Open Market Committee (FOMC) are concerned about the continuation of the disinflationary path. The recent commitments from President-elect Donald Trump are clearly alive in the minds of the Federal Reserve members. Prospects of fewer rate cuts in 2025 widen the rate differential even more between the US and other countries in favor of a stronger US Dollar.
The US economic calendar is further winding down towards the Christmas lull. On Thursday, the third reading for the US Gross Domestic Product is due, as well as the weekly Jobless Claims. The Philadelphia Fed Manufacturing Survey and the Kansas Fed Manufacturing Survey might trigger some last moves.
Daily digest market movers: Not much expected from US GDP
- A government shutdown is looming in the US. Both the House of Representatives and the Senate are rushing to pass a stopgap bill. Meanwhile, President-elect Donald Trump already said he opposed the bill, according to Fox News.
- A chunky batch of data will be released at 13:30 GMT:
- Weekly Jobless Claims:
- Initial Jobless Claims should decline to 230,000 for the week ending December 6 from 242,000 the week before.
- The third reading for the Gross Domestic Product for the third quarter will be released as well.
- Economists don’t expect revisions, with annualized GDP growth steady at 2.8%, headline Personal Consumption Expenditures (PCE) Price Index unchanged at 1.5%, core PCE stable at 2.1%, and GDP Price index also unchanged at 1.9%.
- The Philadelphia Fed Manufacturing Survey for December is expected to move out of contraction to a positive 3 against the previous -5.5.
- Weekly Jobless Claims:
- At 16:00 GMT, the Kansas Fed Manufacturing Activity for December will be issued. The previous reading showed a contraction at -4.
- Equities in Europe and Asia are falling in the wake of the Fed rate decision. US futures, meanwhile, are trying to recover after their correction from Wednesday and are overall up by less than 0.50%.
- The CME FedWatch Tool for the first Fed meeting of 2025 on January 29 sees a 91.4% chance for a stable policy rate against a small 8.6% chance for a 25 basis points rate cut.
- The US 10-year benchmark rate trades at 4.54%, a fresh seven-month high.
US Dollar Index Technical Analysis: Take the money and run
The US Dollar Index (DXY) appears to have played its last hand for 2024. After the Fed rate decision and the release of the dot plot, the DXY increased to a fresh two-year high at 108.28 to later suffer from profit taking. The expectation is that the DXY might correct further until 107.35 or even 106.52 before finding solid support.
A fresh set of levels need to be defined to the upside. The first up is 109.29, which was the peak of July 14 2022 and has a good track record as a pivotal level. Once that level is surpassed, the 110.00 round level comes into play.
Under the pressure of some profit taking, the DXY could now look for some solid support. The first downside barrier comes in at 107.35, which has now turned from resistance into support. The second level that might be able to halt any selling pressure comes in at 106.52. From there, even 105.53 could come under consideration while the 55-day Simple Moving Average (SMA) at 105.23 is making its way up to that level.
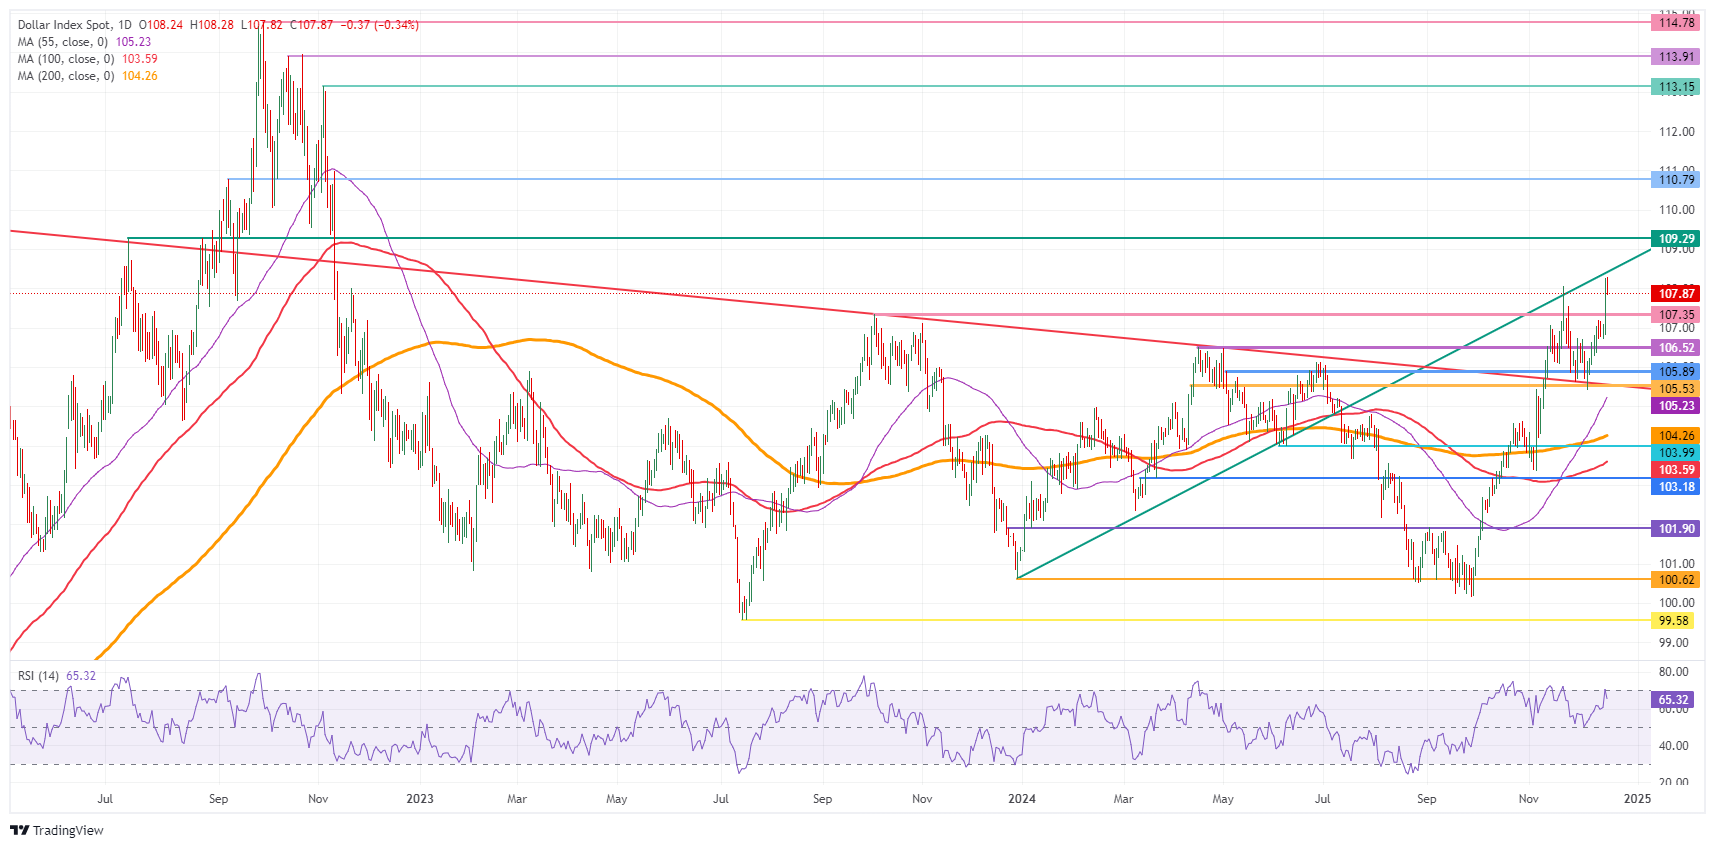
US Dollar Index: Daily Chart
US Dollar FAQs
The US Dollar (USD) is the official currency of the United States of America, and the ‘de facto’ currency of a significant number of other countries where it is found in circulation alongside local notes. It is the most heavily traded currency in the world, accounting for over 88% of all global foreign exchange turnover, or an average of $6.6 trillion in transactions per day, according to data from 2022. Following the second world war, the USD took over from the British Pound as the world’s reserve currency. For most of its history, the US Dollar was backed by Gold, until the Bretton Woods Agreement in 1971 when the Gold Standard went away.
The most important single factor impacting on the value of the US Dollar is monetary policy, which is shaped by the Federal Reserve (Fed). The Fed has two mandates: to achieve price stability (control inflation) and foster full employment. Its primary tool to achieve these two goals is by adjusting interest rates. When prices are rising too quickly and inflation is above the Fed’s 2% target, the Fed will raise rates, which helps the USD value. When inflation falls below 2% or the Unemployment Rate is too high, the Fed may lower interest rates, which weighs on the Greenback.
In extreme situations, the Federal Reserve can also print more Dollars and enact quantitative easing (QE). QE is the process by which the Fed substantially increases the flow of credit in a stuck financial system. It is a non-standard policy measure used when credit has dried up because banks will not lend to each other (out of the fear of counterparty default). It is a last resort when simply lowering interest rates is unlikely to achieve the necessary result. It was the Fed’s weapon of choice to combat the credit crunch that occurred during the Great Financial Crisis in 2008. It involves the Fed printing more Dollars and using them to buy US government bonds predominantly from financial institutions. QE usually leads to a weaker US Dollar.
Quantitative tightening (QT) is the reverse process whereby the Federal Reserve stops buying bonds from financial institutions and does not reinvest the principal from the bonds it holds maturing in new purchases. It is usually positive for the US Dollar.
추천 기사


