
Dow Jones Industrial Average flattens on cautious Tuesday
- The Dow Jones traded into the middle on Tuesday.
- Equities tested lower but stuck to the day’s opening bids.
- Markets are coiling ahead of key US CPI inflation update.
The Dow Jones Industrial Average (DJIA) flat-lined on Tuesday, testing briefly into the low end below 44,200 before rebounding into the day’s opening prices near 44,400. Equities are stuck in the mud as investors await the latest print of US Consumer Price Index (CPI) inflation, slated for Wednesday.
Investors will be keeping a close eye on Wednesday’s CPI inflation print which serves as one of the last key data releases before the Federal Reserve’s (Fed) last policy meeting in 2024. Signs that progress on inflation has stalled could kill hopes for a third consecutive rate cut on December 18.
China’s recently-announced policy pivot represents the Asian giant’s first step toward a looser monetary policy stance since the early 2010s. Investors broadly reacted positively to the news that China would be injecting much-needed cash directly into the global markets. However, bullish momentum on the news has faded as traders now grapple with the reality that China’s commitments to monetary policy adjustment remain shadowy. To top it off, the conditions that would require a pivot from a decade-plus-long policy stance are less than ideal for investment conditions.
Economic Indicator
Consumer Price Index (YoY)
Inflationary or deflationary tendencies are measured by periodically summing the prices of a basket of representative goods and services and presenting the data as The Consumer Price Index (CPI). CPI data is compiled on a monthly basis and released by the US Department of Labor Statistics. The YoY reading compares the prices of goods in the reference month to the same month a year earlier.The CPI is a key indicator to measure inflation and changes in purchasing trends. Generally speaking, a high reading is seen as bullish for the US Dollar (USD), while a low reading is seen as bearish.
Read more.Next release: Wed Dec 11, 2024 13:30
Frequency: Monthly
Consensus: 2.7%
Previous: 2.6%
Source: US Bureau of Labor Statistics
The US Federal Reserve has a dual mandate of maintaining price stability and maximum employment. According to such mandate, inflation should be at around 2% YoY and has become the weakest pillar of the central bank’s directive ever since the world suffered a pandemic, which extends to these days. Price pressures keep rising amid supply-chain issues and bottlenecks, with the Consumer Price Index (CPI) hanging at multi-decade highs. The Fed has already taken measures to tame inflation and is expected to maintain an aggressive stance in the foreseeable future.
Dow Jones news
A tepid Tuesday market session sees action on the Dow Jones split roughly even between gainers and losers for the day. Merck & Co (MRK) shed 2.5% to fall below $102 per share, while Boeing (BA) rebounded an additional 4.5% and climbed above $164 per share as investors continue to re-bid the battered aerospace manufacturer. Boeing has been besieged by issues of late, including strikes, lawsuits, manufacturing errors, and the worst of all, missed earnings calls. But investors are taking heart after the plane maker announced it would revive its investor appeal by axing ten percent of its global workforce despite a multi-year backlog of customer orders continuing to pile up.
Dow Jones price forecast
The Dow Jones has quietly closed lower for three straight trading days when nobody was looking, dragging intraday price action down below 44,400 after testing record highs above 45,000 just last week. Despite the near-term pulldown, prices remain firmly entrenched on the high end, with bids floating well north of the 50-day Exponential Moving Average (EMA) near 43,437.
Dow Jones daily chart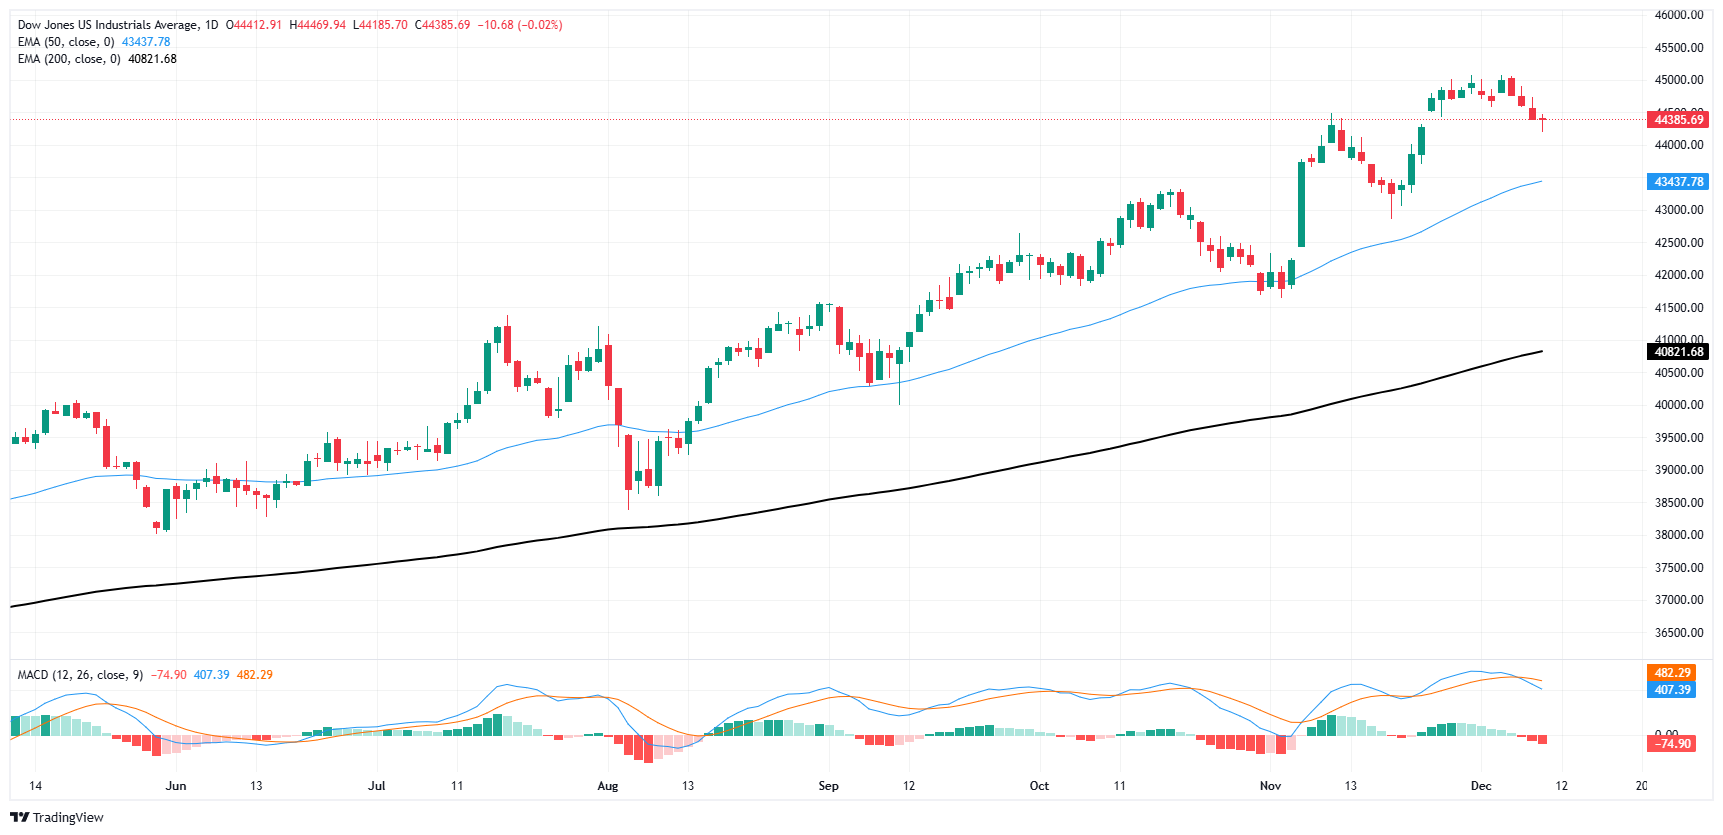
Dow Jones FAQs
The Dow Jones Industrial Average, one of the oldest stock market indices in the world, is compiled of the 30 most traded stocks in the US. The index is price-weighted rather than weighted by capitalization. It is calculated by summing the prices of the constituent stocks and dividing them by a factor, currently 0.152. The index was founded by Charles Dow, who also founded the Wall Street Journal. In later years it has been criticized for not being broadly representative enough because it only tracks 30 conglomerates, unlike broader indices such as the S&P 500.
Many different factors drive the Dow Jones Industrial Average (DJIA). The aggregate performance of the component companies revealed in quarterly company earnings reports is the main one. US and global macroeconomic data also contributes as it impacts on investor sentiment. The level of interest rates, set by the Federal Reserve (Fed), also influences the DJIA as it affects the cost of credit, on which many corporations are heavily reliant. Therefore, inflation can be a major driver as well as other metrics which impact the Fed decisions.
Dow Theory is a method for identifying the primary trend of the stock market developed by Charles Dow. A key step is to compare the direction of the Dow Jones Industrial Average (DJIA) and the Dow Jones Transportation Average (DJTA) and only follow trends where both are moving in the same direction. Volume is a confirmatory criteria. The theory uses elements of peak and trough analysis. Dow’s theory posits three trend phases: accumulation, when smart money starts buying or selling; public participation, when the wider public joins in; and distribution, when the smart money exits.
There are a number of ways to trade the DJIA. One is to use ETFs which allow investors to trade the DJIA as a single security, rather than having to buy shares in all 30 constituent companies. A leading example is the SPDR Dow Jones Industrial Average ETF (DIA). DJIA futures contracts enable traders to speculate on the future value of the index and Options provide the right, but not the obligation, to buy or sell the index at a predetermined price in the future. Mutual funds enable investors to buy a share of a diversified portfolio of DJIA stocks thus providing exposure to the overall index.
추천 기사


