

Dow Jones Industrial Average finds new record highs on peace talks and Trump picks
- The Dow Jones tapped a new all-time high bid just shy of 44,800 on Monday.
- Equity markets are pivoting broadly bullish after Trump signals his Treasury pick.
- Market rumors are swirling that Middle East peace talks could find a resolution soon.
The Dow Jones Industrial Average (DJIA) lurched into the high side on Monday, kicking the new trading week off with a fresh record high just a hair below the 44,800 handle. Investors bid up stock prices on rumors that the ongoing conflict between Israel and Hezbollah in Lebanon may have a ceasefire deal on the table. Closer to home, investors turned further bullish after pending president-elect Donald Trump tapped Scott Bessent as his future Treasury secretary when he returns to the White House in January.
Despite US officials dampening expectations and noting that a ceasefire deal hasn't been officially reached, markets are still optimistic that the geopolitical situation in the Middle East might stabilize later this week. According to an X (née Twitter) post from an AXIOS reporter, A US-proposed truce between Israel and Lebanon that would see Israeli troops withdraw from South Lebanon is set to be voted on, and presumably approved, by both sides in the coming days. Despite an overall uptick in investor sentiment on the prospect of cooling Middle East instability, Crude Oil markets took a hard hit on the news, with West Texas Intermediate (WTI) US Crude Oil backsliding nearly 3% on Monday to $69/barrel.
Investors hit the gas pedal on news that former President Donald Trump will pick Scott Bessent as his Treasury secretary. Scott Bessent is the founder of Key Square Group and a former partner at Soros Fund Management, making Bessent an odd choice for an incoming president who has routinely courted corners of the voting public laden with anti-Soros conspiracy theories.
Despite equity markets rallying hard on the prospect of incoming President Donald Trump tapping a hedge fund manager for a federal oversight position, a notably bullish appointment for the equity field in general, former President Donald Trump’s track record of making dubious staff picks remains unchallenged: the Keystone Group’s fund performance has a notably volatile history. According to reporting from Reuters, institutional investors have fled Keystone Groups in recent years, with the macro-focused hedge fund peaking over $5 billion in AUM in late 2017 and tumbling to a 2024 low of barely over $500 million. Despite Keystone Group opening its doors with seed funding from Soros Capital, Soros has reportedly withdrawn all funding from Bennet’s fund and now has no exposure to the investment vehicle.
Dow Jones news
Despite an early-week bid pin into a new record high, the Dow Jones is settling into a more reasonable stance for Monday, still trading on the high side but easing back from a record high near 44,800. Two-thirds of the major equity index are finding gains on the day, with the remaining third stuck on the red side of the day’s opening line.
Nvidia (NVDA) missed out on Monday’s bullish push, falling another 3.3% and backsliding into $137 per share as investors continue to rebalance their sky-high expectations of the chipmaker. Despite reporting annual revenue growth figures north of 90% last week, bidders in the amorphous AI-tech rally expected more, and are balking at the prospect of Nvidia’s future revenue growth easing from 2025’s 112% forecast to a comparatively sluggish 49% in 2026.
Dow Jones price forecast
The Dow Jones’ Monday bid into a fresh record high near 44,800 has left the blue-chip index back on the high side of a near-term bull run, shrugging off a recent dip into the low well before any bearish technical indicators could form. The Dow Jones is up nearly 19% bottom-to-top in 2024, and up an eye-watering 32% since daily candlesticks last touched the 200-day Exponential Moving Average (EMA) way back in November of 2023 near the 33,800 region.
Dow Jones daily chart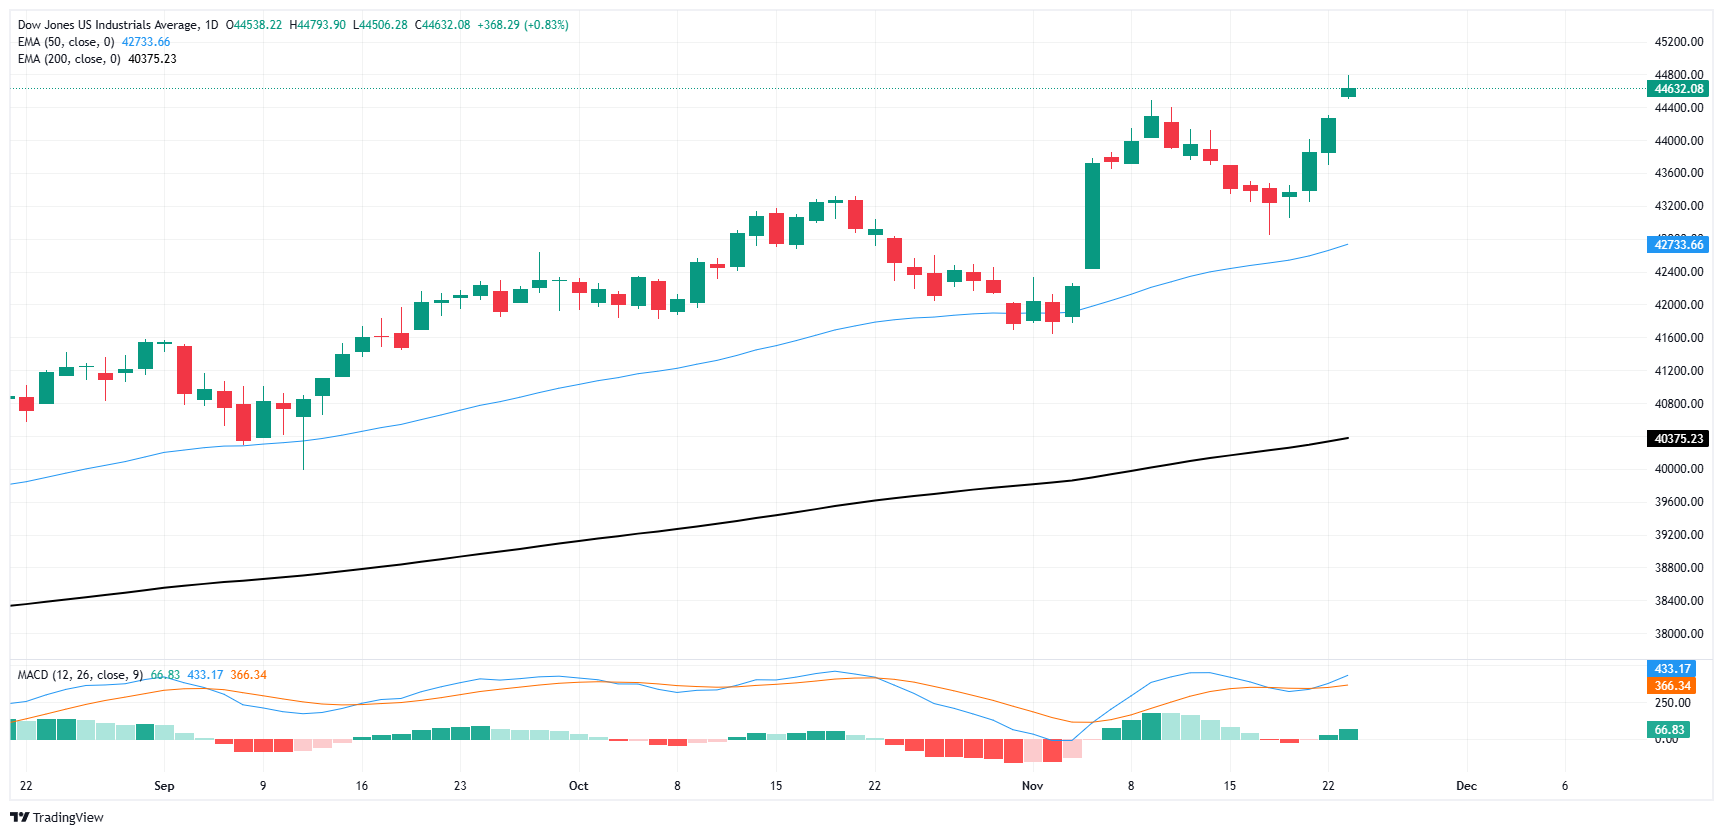
Dow Jones FAQs
The Dow Jones Industrial Average, one of the oldest stock market indices in the world, is compiled of the 30 most traded stocks in the US. The index is price-weighted rather than weighted by capitalization. It is calculated by summing the prices of the constituent stocks and dividing them by a factor, currently 0.152. The index was founded by Charles Dow, who also founded the Wall Street Journal. In later years it has been criticized for not being broadly representative enough because it only tracks 30 conglomerates, unlike broader indices such as the S&P 500.
Many different factors drive the Dow Jones Industrial Average (DJIA). The aggregate performance of the component companies revealed in quarterly company earnings reports is the main one. US and global macroeconomic data also contributes as it impacts on investor sentiment. The level of interest rates, set by the Federal Reserve (Fed), also influences the DJIA as it affects the cost of credit, on which many corporations are heavily reliant. Therefore, inflation can be a major driver as well as other metrics which impact the Fed decisions.
Dow Theory is a method for identifying the primary trend of the stock market developed by Charles Dow. A key step is to compare the direction of the Dow Jones Industrial Average (DJIA) and the Dow Jones Transportation Average (DJTA) and only follow trends where both are moving in the same direction. Volume is a confirmatory criteria. The theory uses elements of peak and trough analysis. Dow’s theory posits three trend phases: accumulation, when smart money starts buying or selling; public participation, when the wider public joins in; and distribution, when the smart money exits.
There are a number of ways to trade the DJIA. One is to use ETFs which allow investors to trade the DJIA as a single security, rather than having to buy shares in all 30 constituent companies. A leading example is the SPDR Dow Jones Industrial Average ETF (DIA). DJIA futures contracts enable traders to speculate on the future value of the index and Options provide the right, but not the obligation, to buy or sell the index at a predetermined price in the future. Mutual funds enable investors to buy a share of a diversified portfolio of DJIA stocks thus providing exposure to the overall index.
추천 기사


