
US Dollar Price Forecast: Hovers around 104.50, remains above nine-day EMA
- The US Dollar Index may test a four-month high of 105.45 level.
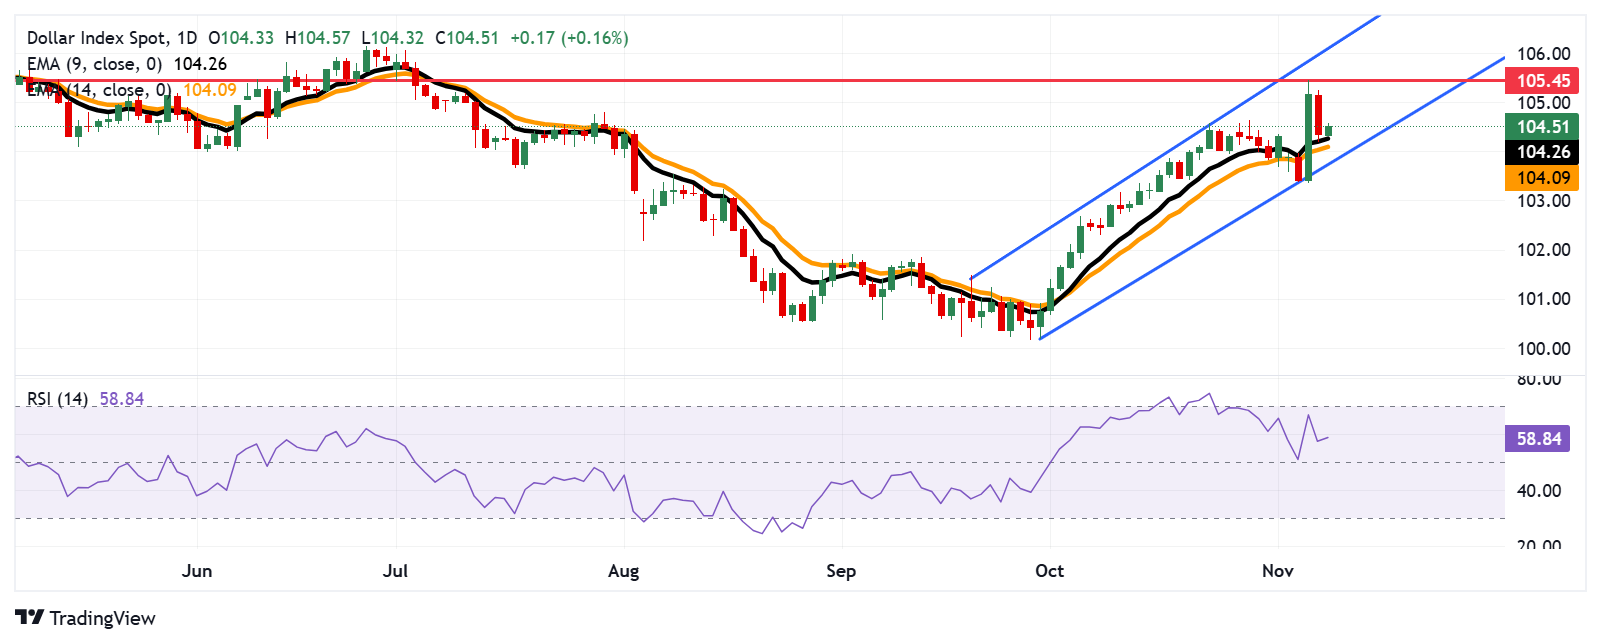
- The DXY keeps a bullish outlook as it moves upwards within an ascending channel.
- The nine-day EMA appears as the immediate support at the 104.25 level.
The US Dollar Index (DXY) maintains its position on daily gains, hovering around 104.50 during European trading hours on Friday. The analysis of the daily chart indicates an ongoing bullish bias as the index moves upwards within an ascending channel.
Additionally, the 14-day Relative Strength Index (RSI) remains above the 50 level, reinforcing the prevailing bullish sentiment. Additionally, the nine-day Exponential Moving Average (EMA) is positioned above the 14-day EMA, indicating short-term price movement upwards
In terms of resistance, the DXY could appreciate toward a four-month high of 105.45 level, which was marked on November 6. A breakthrough above this level could reinforce the market sentiment and support the DXY to approach the upper boundary of the ascending channel at the psychological level of 106.00.
On the downside, the nine-day EMA appears as the immediate support at 104.25 level, followed by the 14-day EMA at 104.09 level. A break below this level could put downward pressure on the US Dollar Index to navigate toward the lower boundary of the ascending channel at 103.70 level.
US Dollar Index: Daily Chart
US Dollar PRICE Today
The table below shows the percentage change of US Dollar (USD) against listed major currencies today. US Dollar was the strongest against the Australian Dollar.
| USD | EUR | GBP | JPY | CAD | AUD | NZD | CHF | |
|---|---|---|---|---|---|---|---|---|
| USD | 0.23% | 0.10% | -0.08% | 0.19% | 0.43% | 0.28% | 0.12% | |
| EUR | -0.23% | -0.13% | -0.28% | -0.04% | 0.20% | 0.06% | -0.12% | |
| GBP | -0.10% | 0.13% | -0.16% | 0.09% | 0.33% | 0.18% | 0.01% | |
| JPY | 0.08% | 0.28% | 0.16% | 0.26% | 0.49% | 0.35% | 0.18% | |
| CAD | -0.19% | 0.04% | -0.09% | -0.26% | 0.23% | 0.10% | -0.07% | |
| AUD | -0.43% | -0.20% | -0.33% | -0.49% | -0.23% | -0.14% | -0.32% | |
| NZD | -0.28% | -0.06% | -0.18% | -0.35% | -0.10% | 0.14% | -0.17% | |
| CHF | -0.12% | 0.12% | -0.01% | -0.18% | 0.07% | 0.32% | 0.17% |
The heat map shows percentage changes of major currencies against each other. The base currency is picked from the left column, while the quote currency is picked from the top row. For example, if you pick the US Dollar from the left column and move along the horizontal line to the Japanese Yen, the percentage change displayed in the box will represent USD (base)/JPY (quote).
추천 기사


