

US Dollar steadies on the US presidential election day
- The US Dollar price action is rather muted as the US heads to the voting booths on Tuesday.
- Traders brace for volatility as it could take days or weeks to know who will be the next US president in case of a very tight result.
- The US Dollar index trades just below 104.00 and hangs onto important technical support.
The US Dollar (USD) steadies on Tuesday, with the US Dollar Index (DXY), which tracks the Greenback’s value against six major currencies, trading just below 104.00 and hanging onto important technical support as markets brace for the US presidential election. Chances that markets will know if either Vice President Kamala Harris or former US President Donald Trump will claim victory by Wednesday look rather slim. No less than 165 lawsuits have already been filed on election fraud and recount requests even before the voting has started.
This could mean that this 60th presidential election could surpass the 46 days of legal uncertainty last seen when George W. Bush won in 2000. Only a landslide victory by several points could avoid a legal battle that would plunge markets into uncertainty going into year-end.
The US economic calendar includes the final readings of the S&P Global and the Institute for Supply Management (ISM) Services Purchase Managers Index (PMI) for October. No real changes are expected from preliminary readings.
Daily digest market movers: Harris vs. Trump showdown
- Look out for headlines risk on Tuesday and Wednesday in case no clear winner is declared in the 60th US presidential election.
- At 13:45 GMT, S&P Global is set to release the final reading for October’s PMI. Services PMI is expected to remain unchanged from the preliminary reading of 55.3, while the Composite PMI is expected to remain stable at 54.3.
- At 15:00 GMT, the ISM is releasing its final reading for October’s services sector. The ISM Services PMI is expected to decline a touch to 53.8 from 54.9.
- Ahead of the first possible headlines on the US presidential election, the US Treasury is auctioning a 10-year note around 18:00 GMT.
- Asia did well on Tuesday, with Japanese and Chinese indices closing in the green. European equities look sluggish ahead of the US presidential elections, while US equity futures are showing mild positive numbers.
- The CME FedWatch Tool is backing a 25 basis point (bps) interest-rate cut by the Federal Reserve (Fed) on Thursday’s meeting with a 98.0% probability. More interesting is the December 18 meeting, where a 50 bps interest-rate cut from the current level is expected by an 81.7% chance, suggesting that markets anticipate a rate cut this week and in December.
- The US 10-year benchmark rate trades at 4.30%, lower than the 4.38% where it closed on Friday.
US Dollar Index Technical Analysis: On the edge of your seat
The US Dollar Index (DXY) is having its calm moment before the storm. It looks to be very unpredictable what the US presidential election outcome will be on Wednesday when the world will wake up. The DXY is clinging onto the 200-day Simple Moving Average (SMA) at 103.84, and it is expected to whipsaw through it in the next 24 hours once results come in.
The DXY has given up two key levels and needs to regain control of them before considering recovering toward 105.00 and higher. First up is the 200-day SMA at 103.84, together with the 104.00 big figure. The second element is the October 29 high at 104.63.
On the downside, the 100-day SMA at 103.12 and the pivotal level of 103.18 ( March 12 high) are the first line of defence. In case of rapid and volatile moves this week, look for 101.90 and the 55-day SMA at 102.16 to consider as substantial support. If that level snaps, an excursion below 101.00 could be possible.
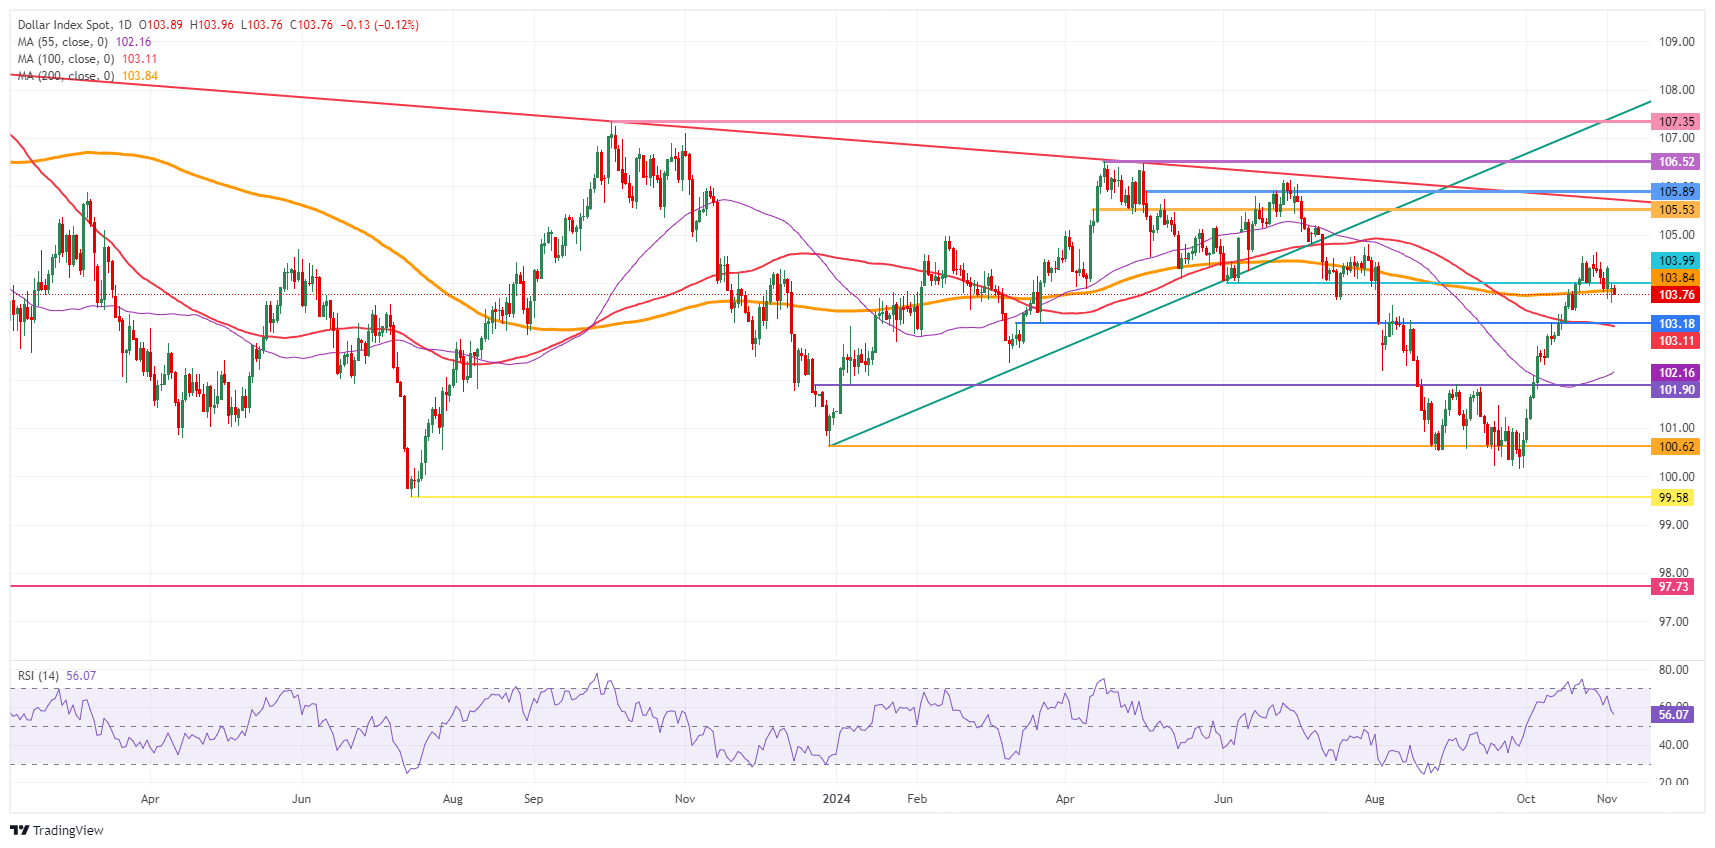
US Dollar Index: Daily Chart
US Dollar FAQs
The US Dollar (USD) is the official currency of the United States of America, and the ‘de facto’ currency of a significant number of other countries where it is found in circulation alongside local notes. It is the most heavily traded currency in the world, accounting for over 88% of all global foreign exchange turnover, or an average of $6.6 trillion in transactions per day, according to data from 2022. Following the second world war, the USD took over from the British Pound as the world’s reserve currency. For most of its history, the US Dollar was backed by Gold, until the Bretton Woods Agreement in 1971 when the Gold Standard went away.
The most important single factor impacting on the value of the US Dollar is monetary policy, which is shaped by the Federal Reserve (Fed). The Fed has two mandates: to achieve price stability (control inflation) and foster full employment. Its primary tool to achieve these two goals is by adjusting interest rates. When prices are rising too quickly and inflation is above the Fed’s 2% target, the Fed will raise rates, which helps the USD value. When inflation falls below 2% or the Unemployment Rate is too high, the Fed may lower interest rates, which weighs on the Greenback.
In extreme situations, the Federal Reserve can also print more Dollars and enact quantitative easing (QE). QE is the process by which the Fed substantially increases the flow of credit in a stuck financial system. It is a non-standard policy measure used when credit has dried up because banks will not lend to each other (out of the fear of counterparty default). It is a last resort when simply lowering interest rates is unlikely to achieve the necessary result. It was the Fed’s weapon of choice to combat the credit crunch that occurred during the Great Financial Crisis in 2008. It involves the Fed printing more Dollars and using them to buy US government bonds predominantly from financial institutions. QE usually leads to a weaker US Dollar.
Quantitative tightening (QT) is the reverse process whereby the Federal Reserve stops buying bonds from financial institutions and does not reinvest the principal from the bonds it holds maturing in new purchases. It is usually positive for the US Dollar.
추천 기사


