
Axiom’s volume surpasses $100M as meme trading platform war escalates on Solana
- Axiom meme coin trading volume hit $101 million for the first time, surpassing other platforms on Solana.
- Axiom accounts for 30% of the ecosystem’s trading users, followed by Photon and Bullx at 24% each.
- Axiom boasts strong features, including a Twitter tracker, Trace Wallet integration and financial management.
- Solana stays bullish above $130 amid a strengthening technical picture likely to trigger extended gains to $185.
Axiom’s daily trading volume surged on Monday, reaching $101,000 million for the first time, surpassing all other meme coin trading platforms on Solana, such as Photon and Bullx. Meanwhile, Solana (SOL) exchanges hands at $132 at the time of writing on Tuesday after staging a recovery campaign from the ‘Black Monday’ crash on April 7 to $95 triggered by United States (US) President Donald Trump’s reciprocal tariffs.
Cryptocurrencies, including Bitcoin (BTC) and leading altcoins like Ethereum (ETH) and Ripple (XRP), generally recovered after the 90-day tariff pause in the middle of last week. With the trade war cooling, Bitcoin is expected to close in on $90,000, Solana could soon rise above $140, and Ethereum may reclaim support at $2,000 in the coming days.
Axiom’s trading volume tops meme coin trading platforms on Solana
According to on-chain data on Dune, the Y Combinator incubated Axiom meme coin trading platform on Solana accounted for over 50% of the daily volume in the ecosystem on Monday. Photon has approximately $36 million in daily volume, coming at a distant second, while Bullx took the third spot with roughly $26 million.
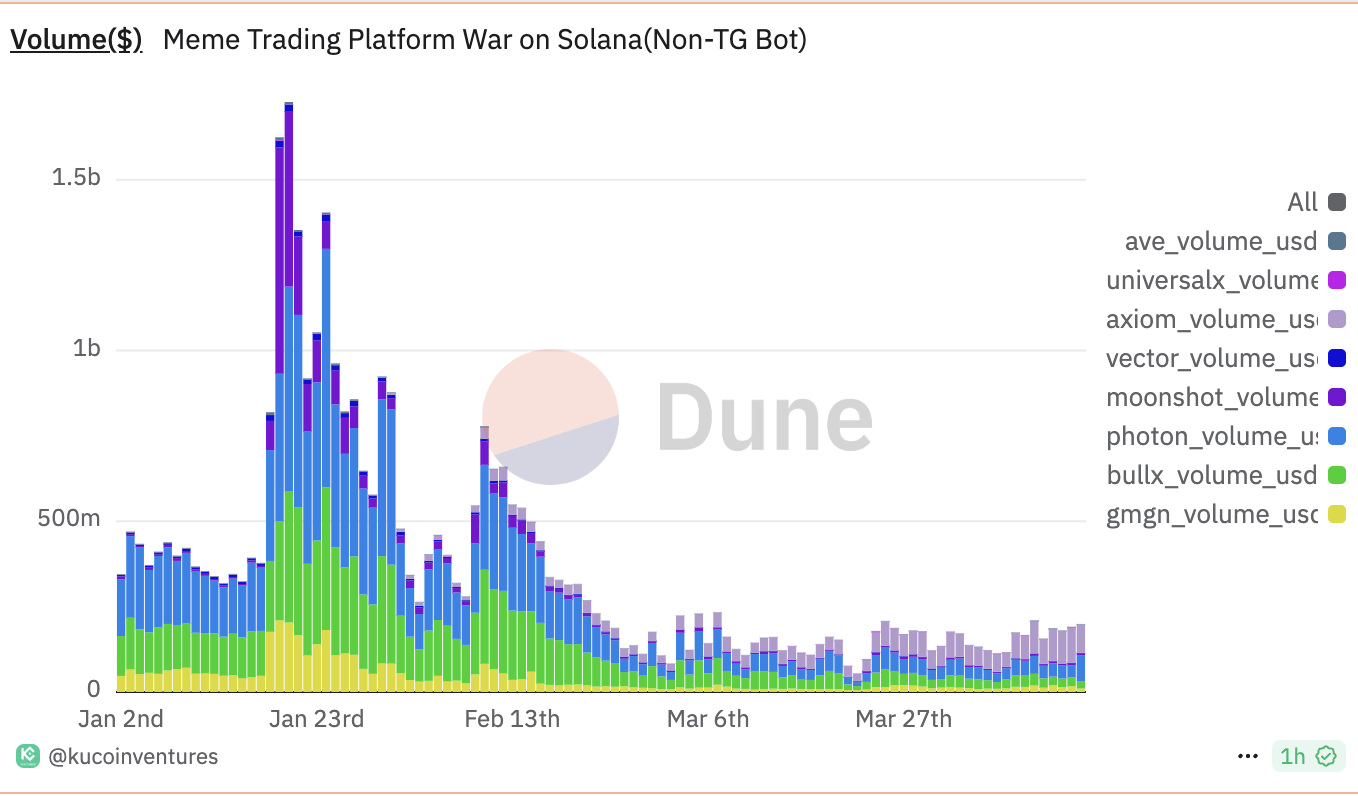
Meme coin trading platforms | Source Dune
Axiom continued its dominance, accounting for 26,769 traders. Photon and Bullx reported 22,775 and 22,720 trading users, respectively. As per the chart below, Axiom leads the Solana meme coin traders’ market share at almost 30%, beating Photon’s 24.3% and Bullx’s 24.2%.
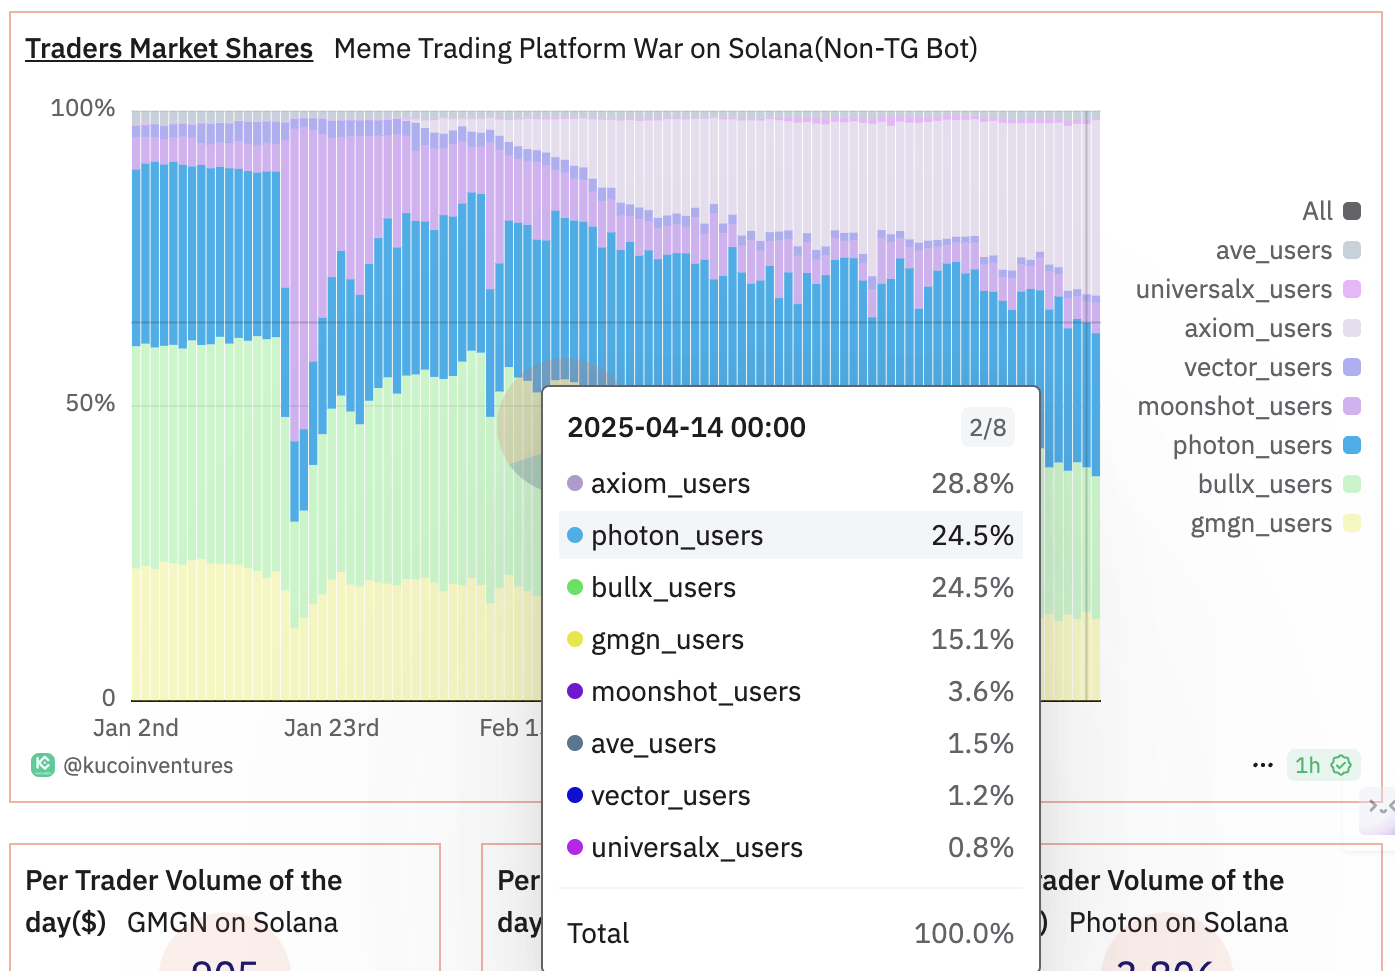
Meme coin trading platforms | Source Dune
According to WuBlockchain, Axiom is gaining traction due to several unique features, including the ability to track feeds on X (Twitter), its integration with Wallet Tracer, and financial management. Axiom boasts unique user retention features, such as invitation rebates to attract customers. Nonetheless, WuBlockchain cautioned that there could be false trading behavior.
Solana meme coin trading activity has gradually improved following the Libra meme coin implosion early in the year. This and other factors like tariffs have seen traders take a back seat to access their strategies and plausibly avoid falling into market manipulation risks.
Solana breaks falling wedge pattern resistance
Solana’s price ascended above $130 after validating a falling wedge pattern’s breakout, with a 55% target to approximately $185. If volume increases, the smart contract token could soon flip the 50-day Exponential Moving Average (EMA) resistance at $136 into support.
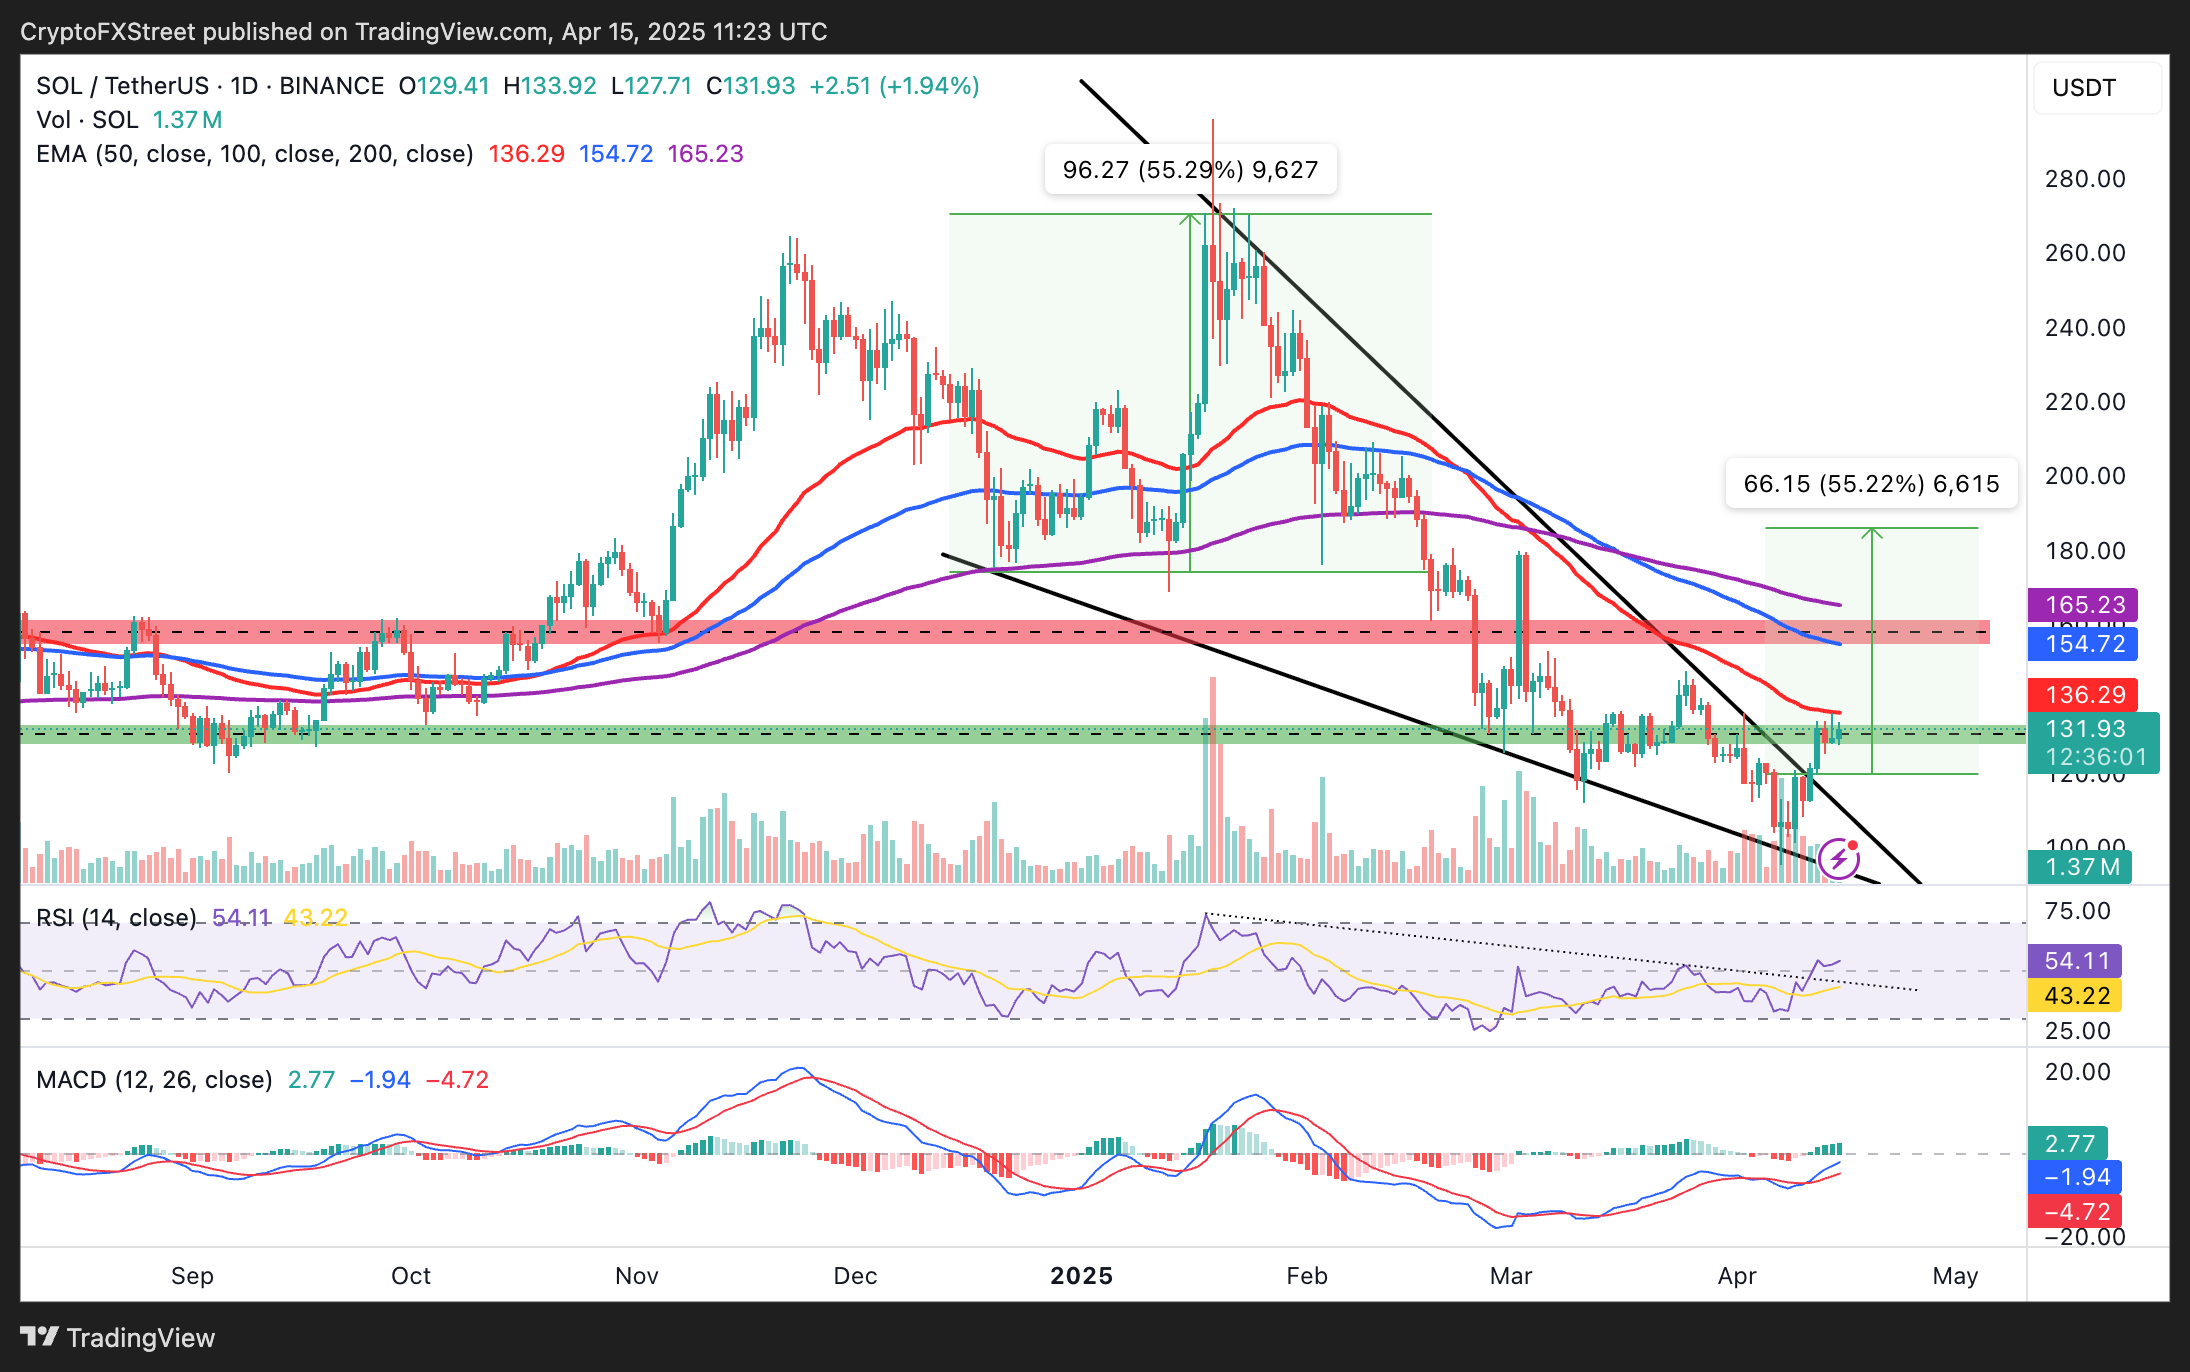
SOL/USDT daily chart
The next critical levels for Solana’s price recovery are the 100-day and 200-day EMAs, sitting at $154 and $165, respectively. As traders chase exposure, betting on higher prices fueled by a strong technical setup – highlighted by a buy signal from the Moving Average Convergence Divergence (MACD) indicator and an uptrending Relative Strength Index (RSI) – the chances of SOL climbing to $185 grow substantially. Still, traders should stay cautious, as profit-taking and broader macroeconomic risks could push Solana back to the $100 support level.
Cryptocurrency metrics FAQs
The developer or creator of each cryptocurrency decides on the total number of tokens that can be minted or issued. Only a certain number of these assets can be minted by mining, staking or other mechanisms. This is defined by the algorithm of the underlying blockchain technology. On the other hand, circulating supply can also be decreased via actions such as burning tokens, or mistakenly sending assets to addresses of other incompatible blockchains.
Market capitalization is the result of multiplying the circulating supply of a certain asset by the asset’s current market value.
Trading volume refers to the total number of tokens for a specific asset that has been transacted or exchanged between buyers and sellers within set trading hours, for example, 24 hours. It is used to gauge market sentiment, this metric combines all volumes on centralized exchanges and decentralized exchanges. Increasing trading volume often denotes the demand for a certain asset as more people are buying and selling the cryptocurrency.
Funding rates are a concept designed to encourage traders to take positions and ensure perpetual contract prices match spot markets. It defines a mechanism by exchanges to ensure that future prices and index prices periodic payments regularly converge. When the funding rate is positive, the price of the perpetual contract is higher than the mark price. This means traders who are bullish and have opened long positions pay traders who are in short positions. On the other hand, a negative funding rate means perpetual prices are below the mark price, and hence traders with short positions pay traders who have opened long positions.
추천 기사


