
Bitcoin, Ethereum and XRP steady as China slaps 125% tariff on US, weekend sell-off looming?
- Effective Saturday, China raises levies on US imports to 125% to counter Trump's tariffs.
- Global markets are expected to react amid risks of clawing back Wednesday's tariff pause-triggered gains.
- Bitcoin is steady above $82,000, Ethereum hovers above $1,550, while XRP holds onto $2.
The Cryptocurrency market shows stability at the time of writing on Friday, with Bitcoin (BTC) holding steady at $82,584, Ethereum (ETH) at $1,569, and Ripple (XRP) maintaining its position above $2.00. This follows news that China has increased duties on United States imports in a fresh retaliatory move to counter President Donald Trump's 145% tariff on Chinese goods.
China and the US escalate tariff war
China's Finance Ministry announced on Friday that it is raising tariffs on US imports from 84% to 125%, as reported by Reuters. The new levy will come into effect on Saturday, countering President Trump's recent decision to hike tariffs on Chinese imports to 145%.
The US-China trade war is in overdrive, with the Asian economic giant vowing to fight to the end. "If the US insists on continuing to infringe upon China's interests in a substantive way, China will resolutely take countermeasures and fight to the end," the ministry said.
The midweek tariff-pause relief saw cryptocurrencies recover alongside global markets in the US and Asia. However, escalating trade tensions between China and the US could reverse the gains, sending markets into another spiral.
Bitcoin could sustain bullish outlook into the weekend
Bitcoin price edges higher during the European session, from Friday's open at $79,607 to $82,584 at the time of writing, representing a 3.8% change on the day. Bulls seemed ready to tackle the trendline resistance, as highlighted in the daily chart.
The Relative Strength Index (RSI) indicator holds at 48.94 and is on the verge of crossing the upper neutral half. This suggests that bulls have the upper hand and are likely to push for a higher close during the American session.
Moreover, the Moving Average Convergence Divergence (MACD) indicator revealed a potential buy signal, likely to manifest with the MACD line (blue) flipping above the signal line (red). Traders watching this indicator may increase exposure to BTC, betting on a larger price increase targeting the 200-day Exponential Moving Average (EMA) at $85,055.
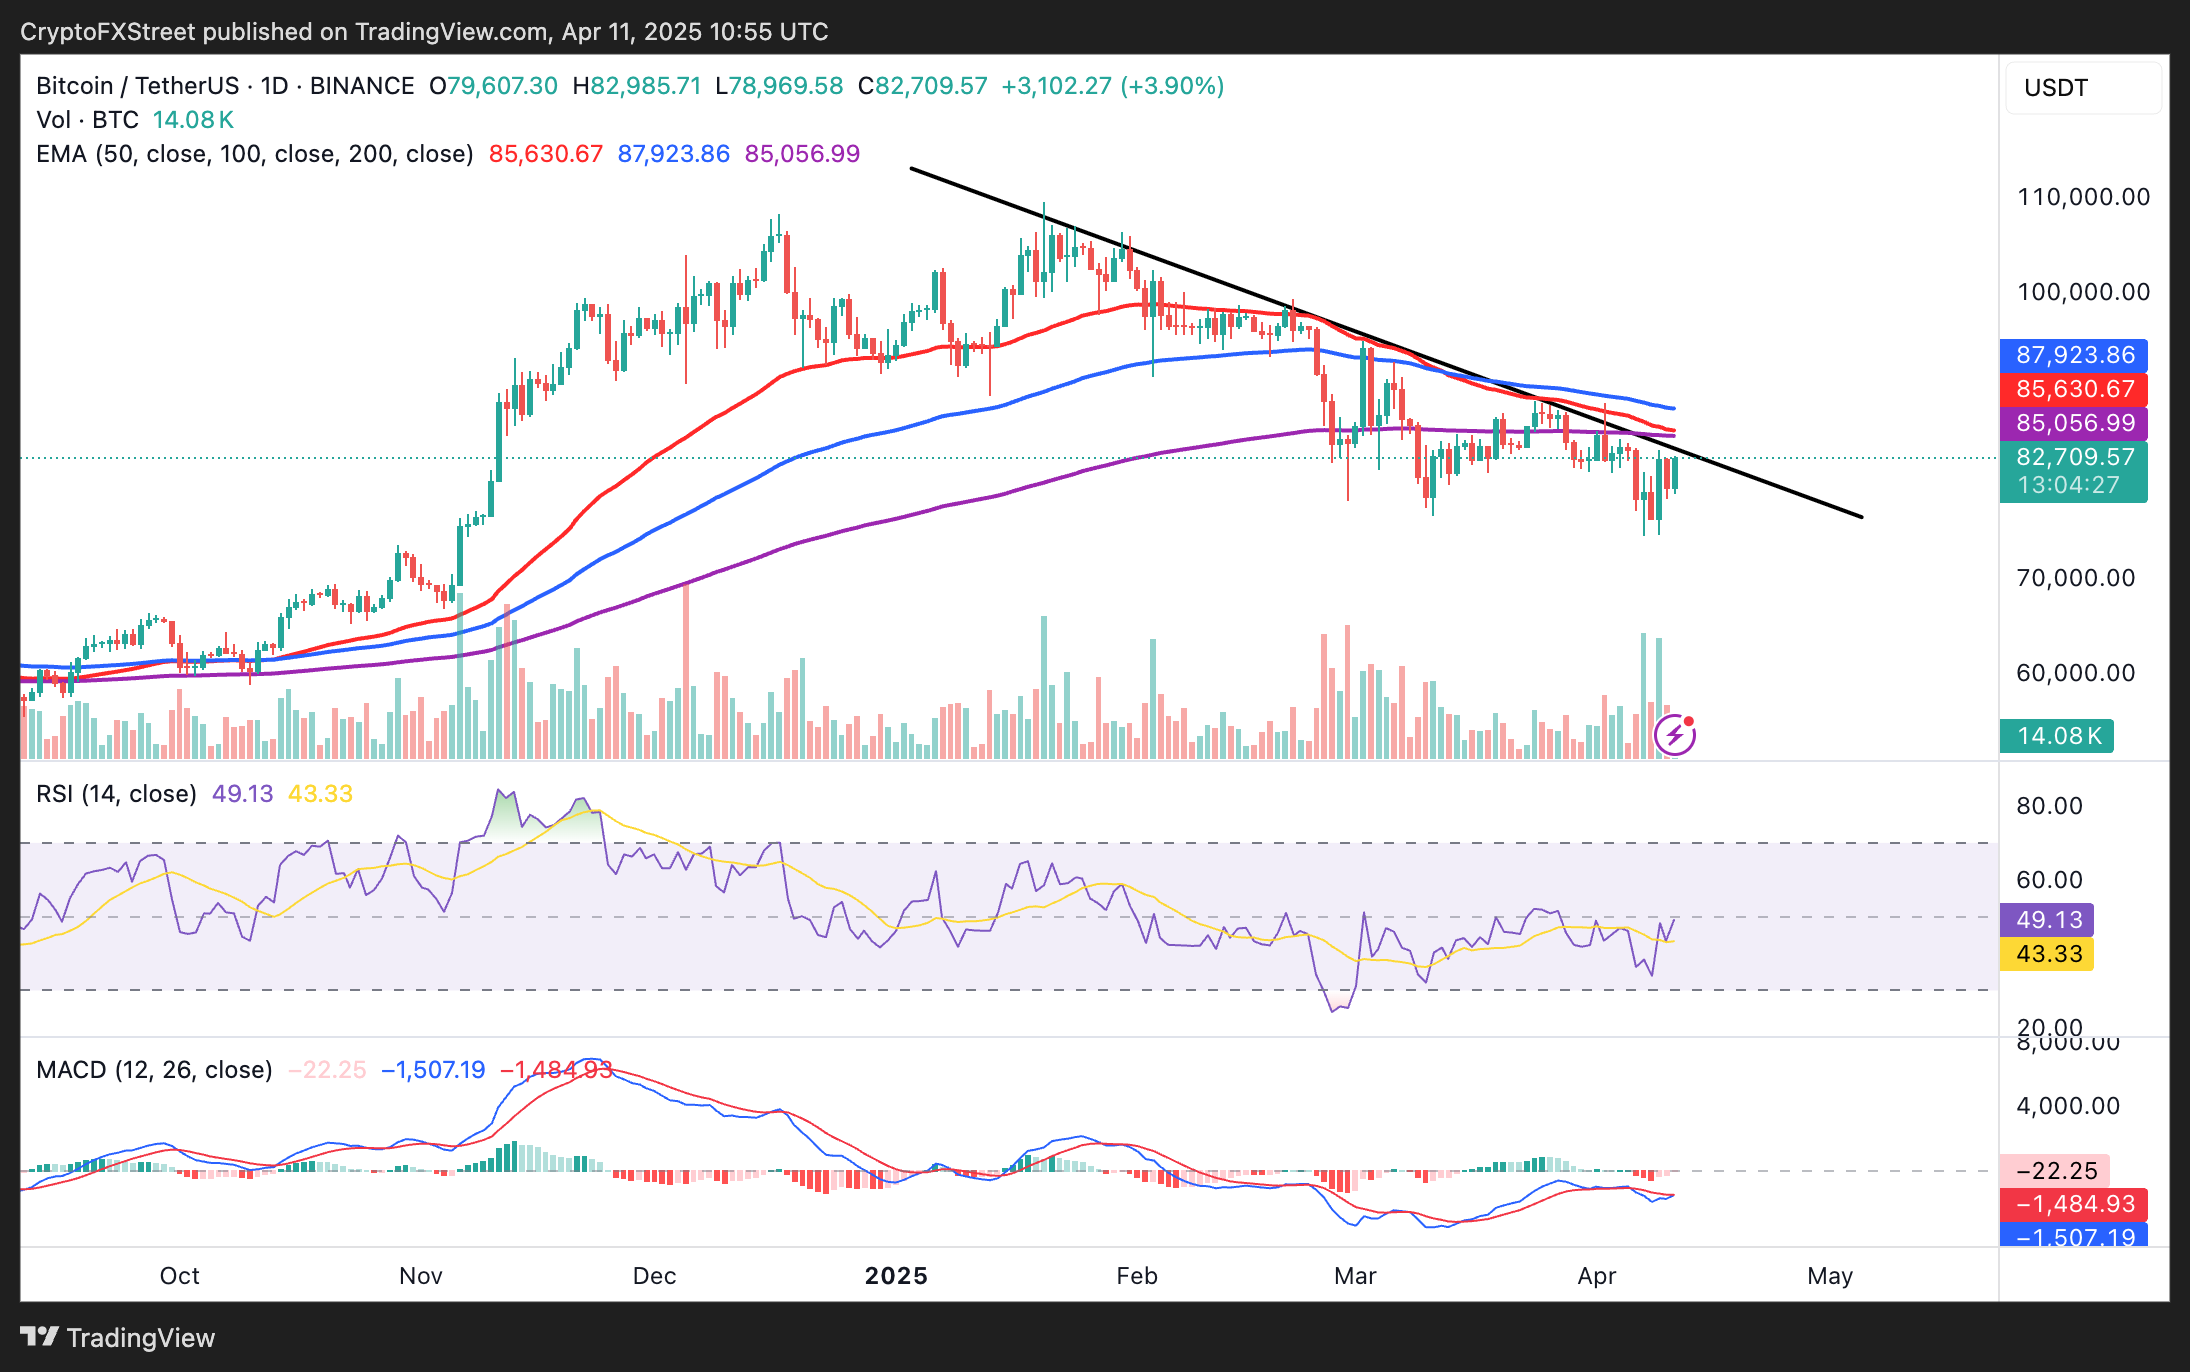
BTC/USD daily chart
On the other hand, Bitcoin still sits below the 50-day EMA at $85,629, the 100-day EMA at $87,924 and the 200-day EMA, not to mention the 3-month descending trendline. These critical levels challenge the push for higher price levels and could represent key pain points leading to losses below the $80,000 mark.
Can ETH escape the descending channel trap?
Ethereum price retested and defended its descending channel support, igniting an immediate rebound to $1,694 after President Trump paused tariffs on Wednesday. However, bulls faced weakness in their push for more gains on Thursday, leading to a minor dip to $1,477.
Interest in the largest altcoin by market capitalization has been growing in the last 24 hours, suggesting that a breakout from the 4-month descending channel could be seen soon. Ethereum bulls have several immediate targets, including the 50-day EMA at $2,034, the 100-day EMA at $2,367, and the 200-day EMA at $2,639.
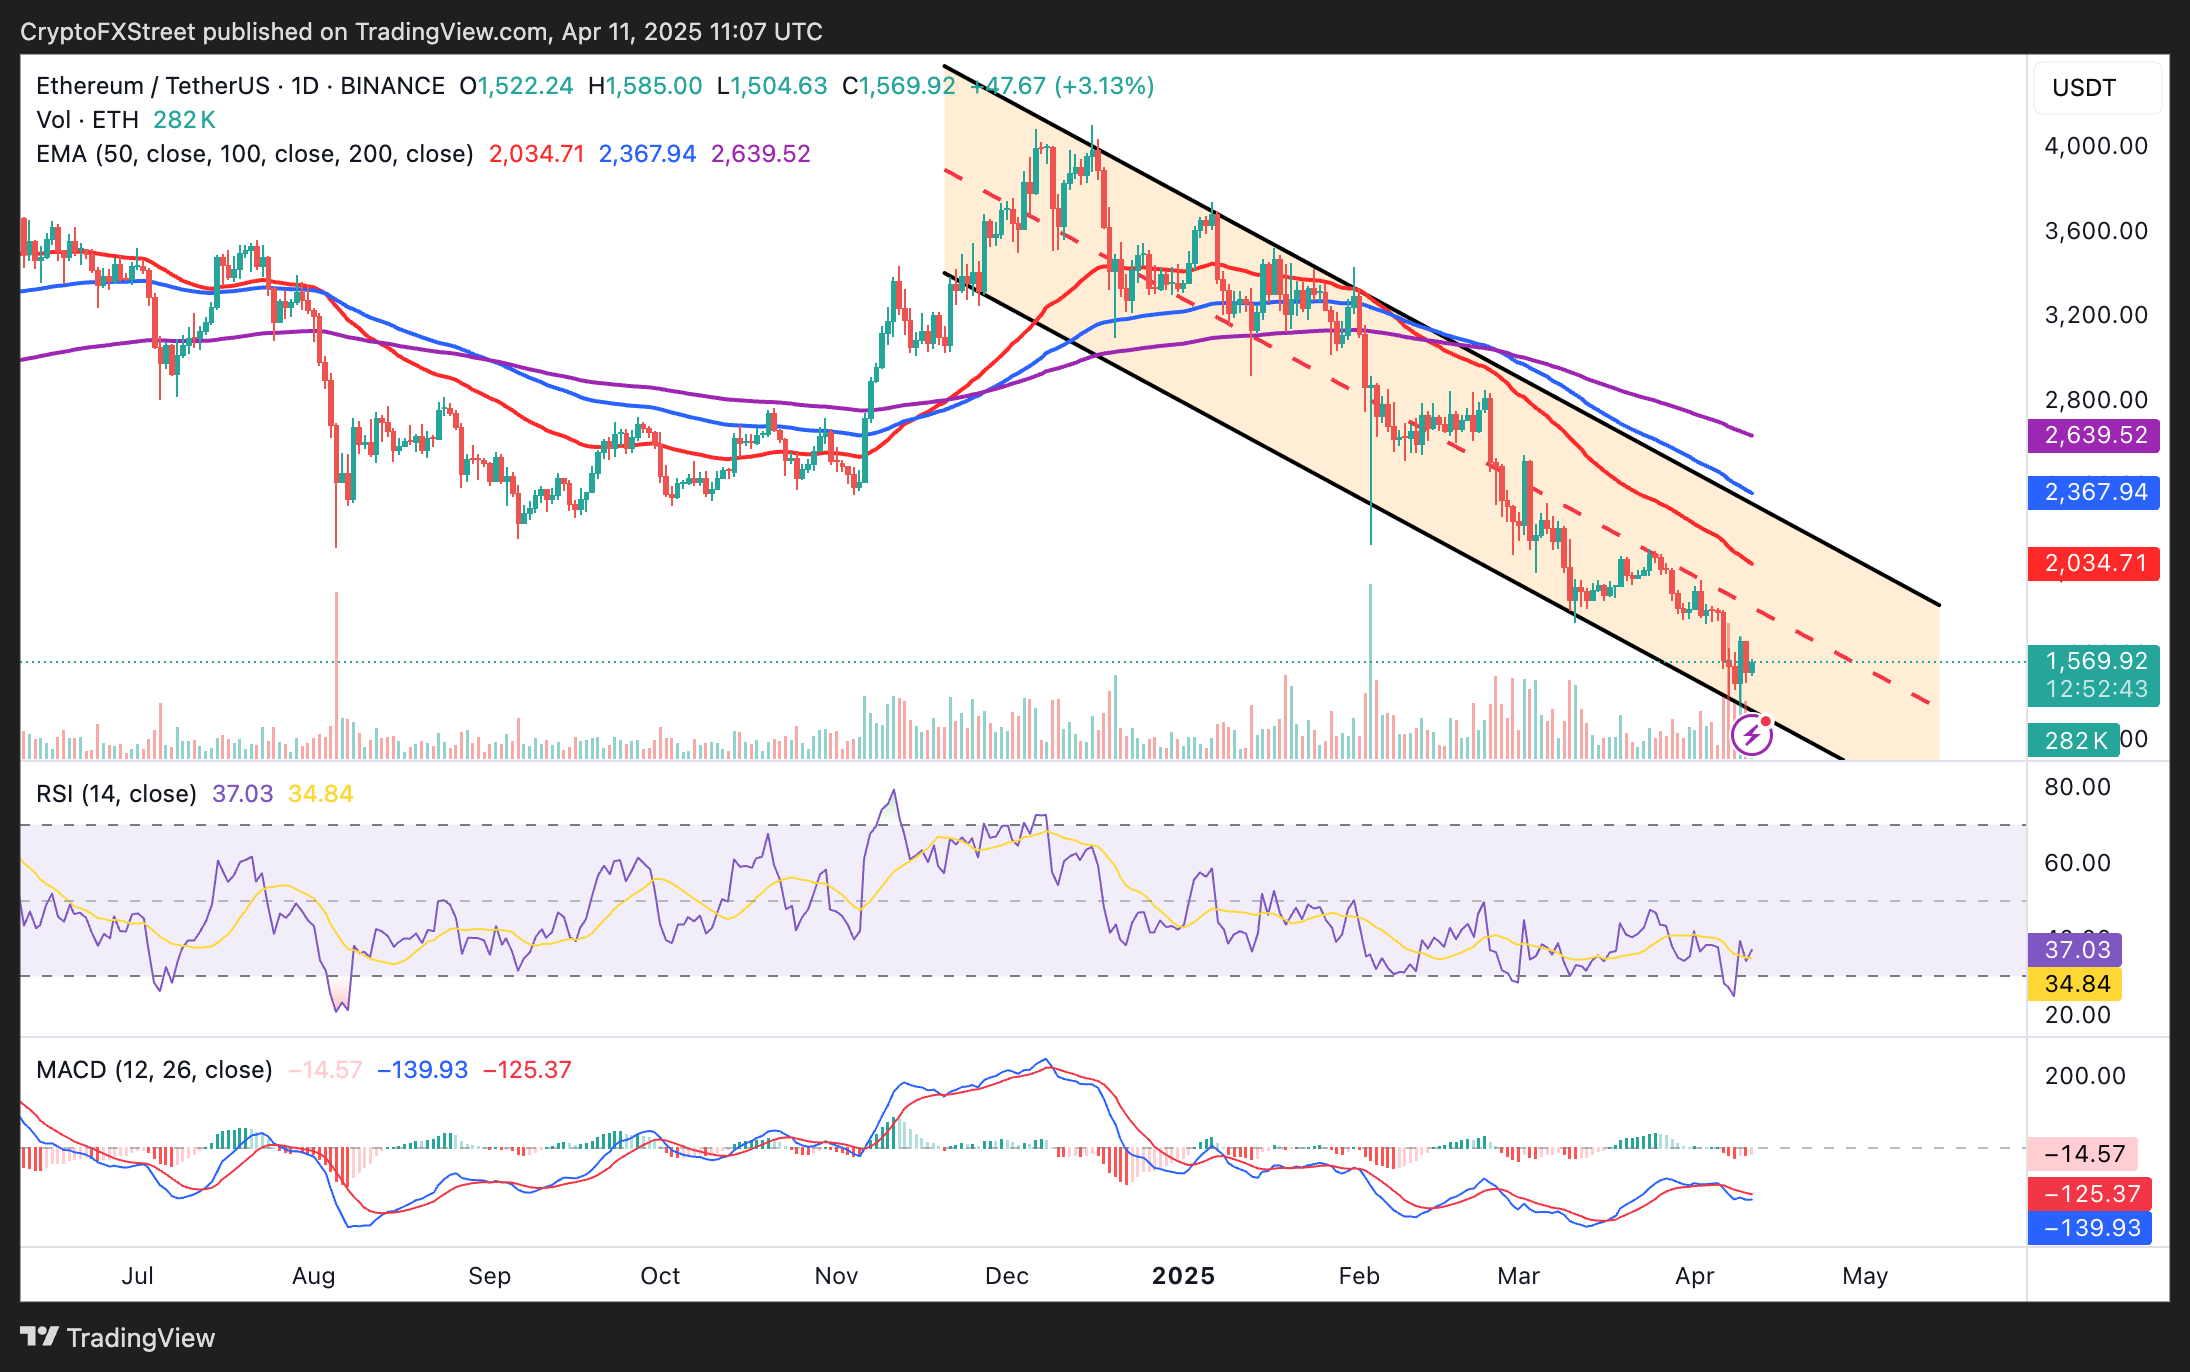
ETH/USD daily chart
Traders must consider that Ethereum still trades below three EMAs, which poses a risk to the bullish momentum. Moreover, the descending channel has been forming since mid-December, and breaking free might take longer than expected.
XRP builds support at $2
Since recovering from Monday's low at $1.62, support at $2.00 has been on the bulls' radar. XRP initially reclaimed the 200-day EMA at $1.95, flipping it into support and allowing ample time to tackle the pivotal $2.00 level.
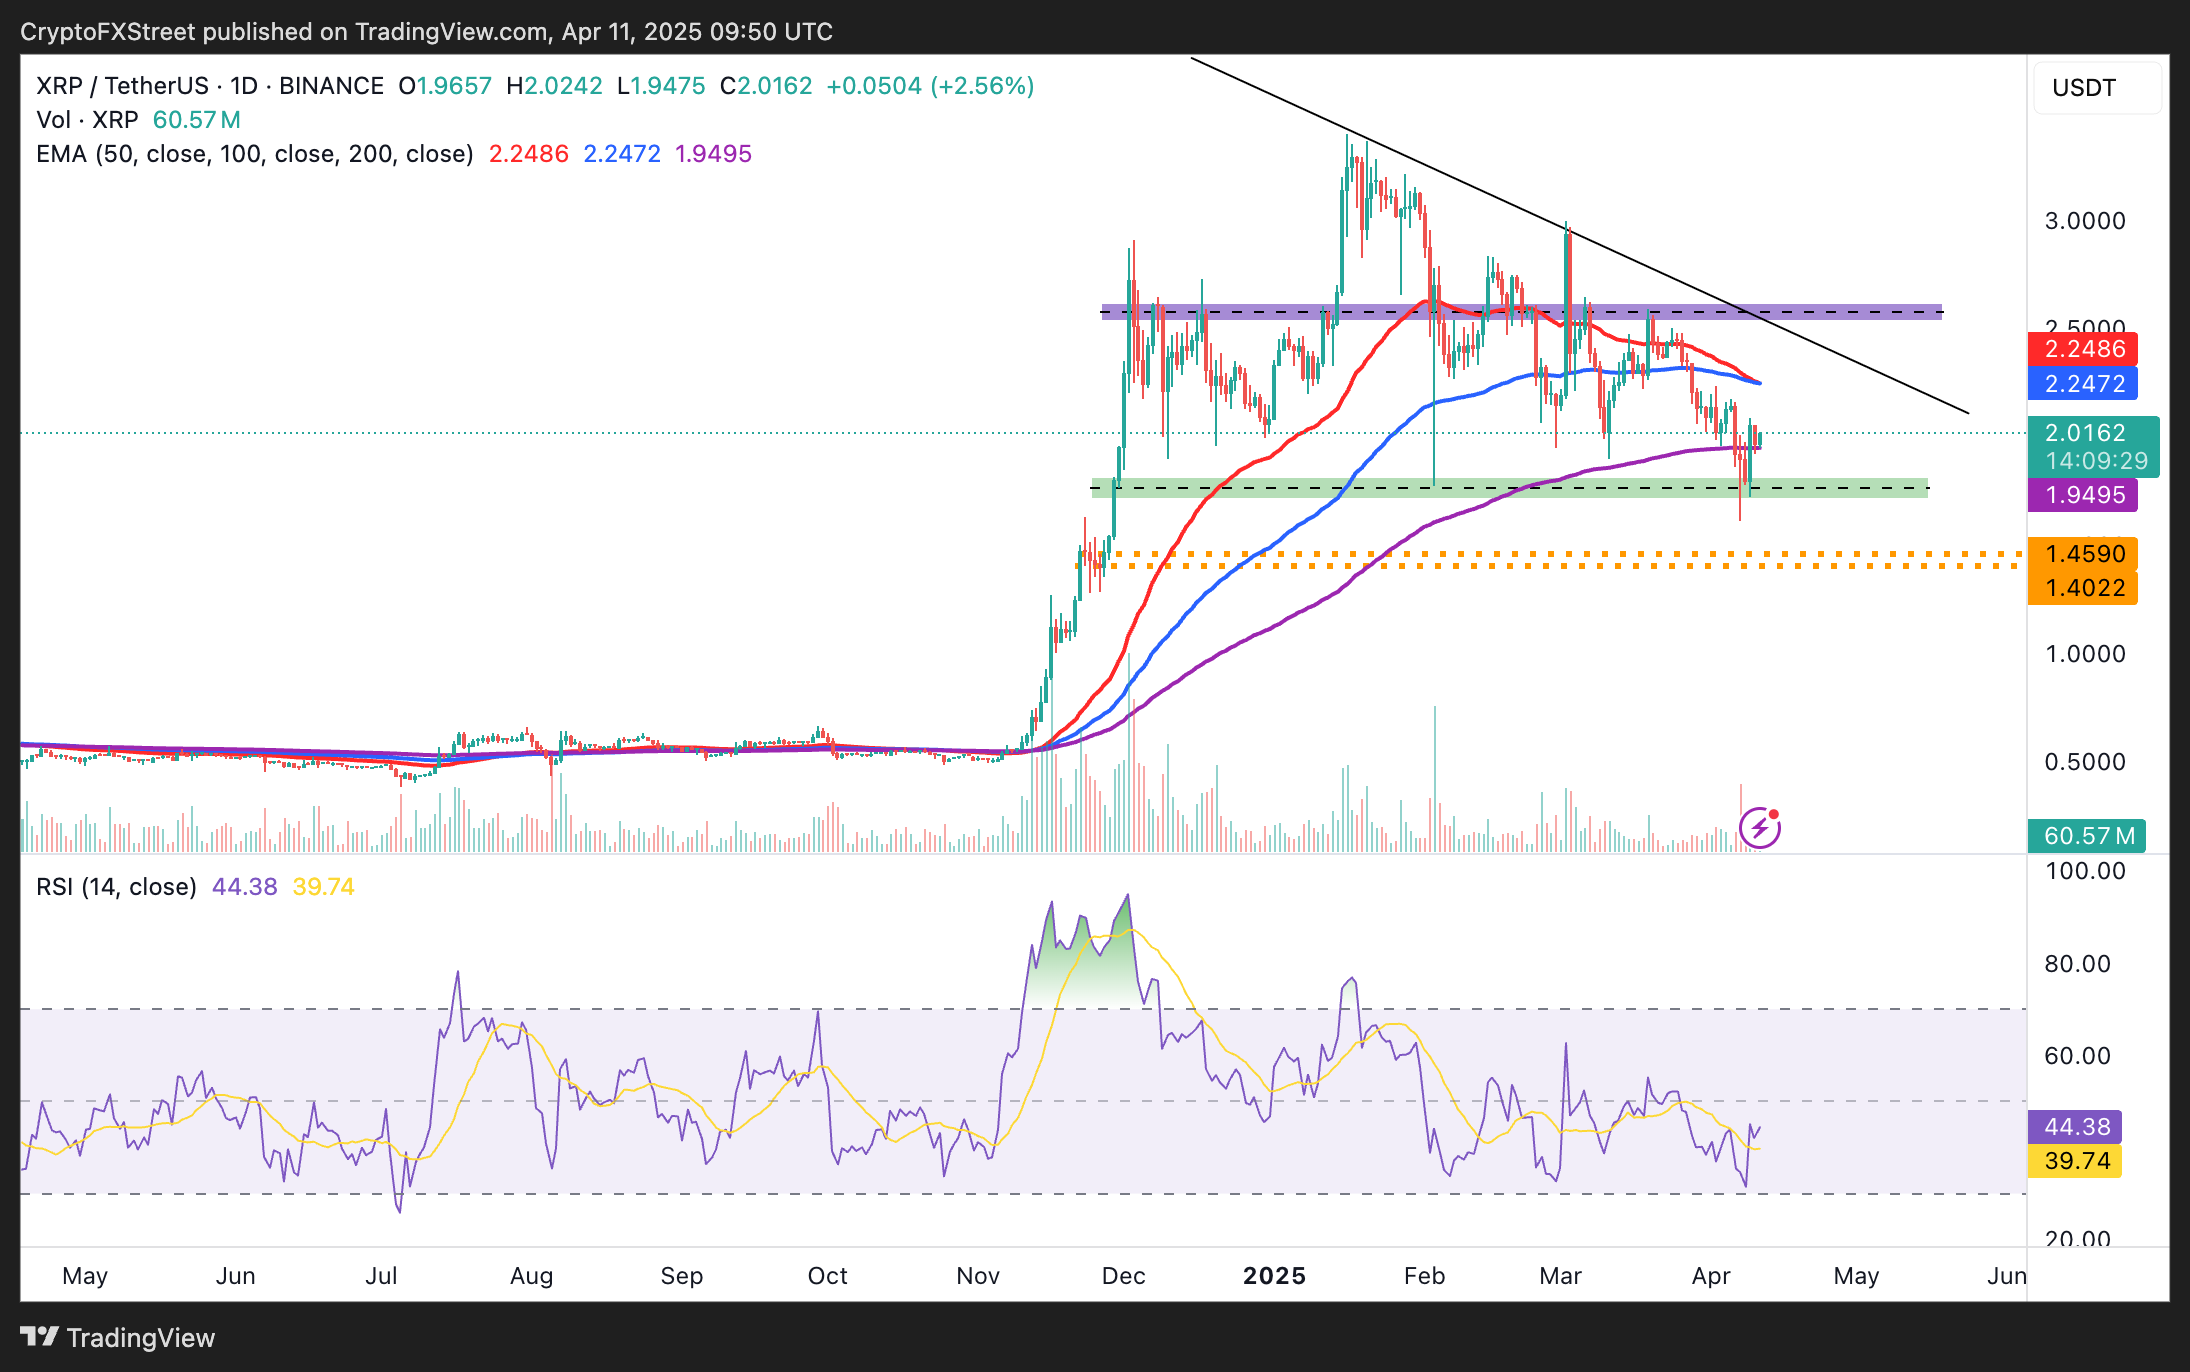
XRP/USD daily chart
The MACD and the RSI indicators are responding positively, hinting at further price increases into the weekend. With the RSI neutral but holding at 44.52 and the MACD likely to send a buy signal in the daily chart, XRP could affirm support at $2.00 and chart the path to $2.24, a resistance area highlighted by the 50-day EMA and the 100-day EMA.
추천 기사


