Top 3 gainers Supra, Cosmos Hub, EOS: Supra leads recovery after Trump’s tariffs announcement
- Supra’s 25% surge on Friday calls attention to lesser-known cryptocurrencies as Bitcoin, Ethereum and XRP struggle.
- Cosmos Hub remains range-bound while bulls focus on a potential inverse head-and-shoulders pattern breakout.
- EOS sustains a bullish outlook after the network’s strategic relaunch as a Web3 financial powerhouse.
Supra (SUPRA), the first all-in-one Multi-VM Layer 1 built for super decentralized applications (dApps), is up 25% daily and trades at $0.0066 at the time of writing on Friday. Although range-bound since early February, Cosmos Hub (ATOM) flaunts a bullish technical pattern likely to set it on a clear recovery path above $5.
On the other hand, EOS has been moving higher amid growing investor interest following the network’s rebranding to Vaulta on March 18 as part of a strategic pivot toward Web3 banking services.
As the week ends, traders may want to watch how the crypto market digests United States (US) President Donald Trump’s reciprocal tariffs announcement. Major assets like Bitcoin (BTC), Ethereum (ETH), and XRP remain relatively stable but struggle to sustain recovery.
Supra rallies 25% as more projects join the ecosystem
Supra is one of the fastest-growing platforms catering to Super dApps like Crystara Markets, the first NFT marketplace in the ecosystem. The platform’s integration with Defi Llama significantly boosts the high-performance Layer 1 blockchain. The protocol boasts a remarkable transaction throughput, thanks to its Moonshot consensus.
Supra’s surge in the last 24 hours while most cryptocurrencies digested the tariff news implies that traders are eager for projects striving to solve key industry problems, including Web3 support for decentralized applications.
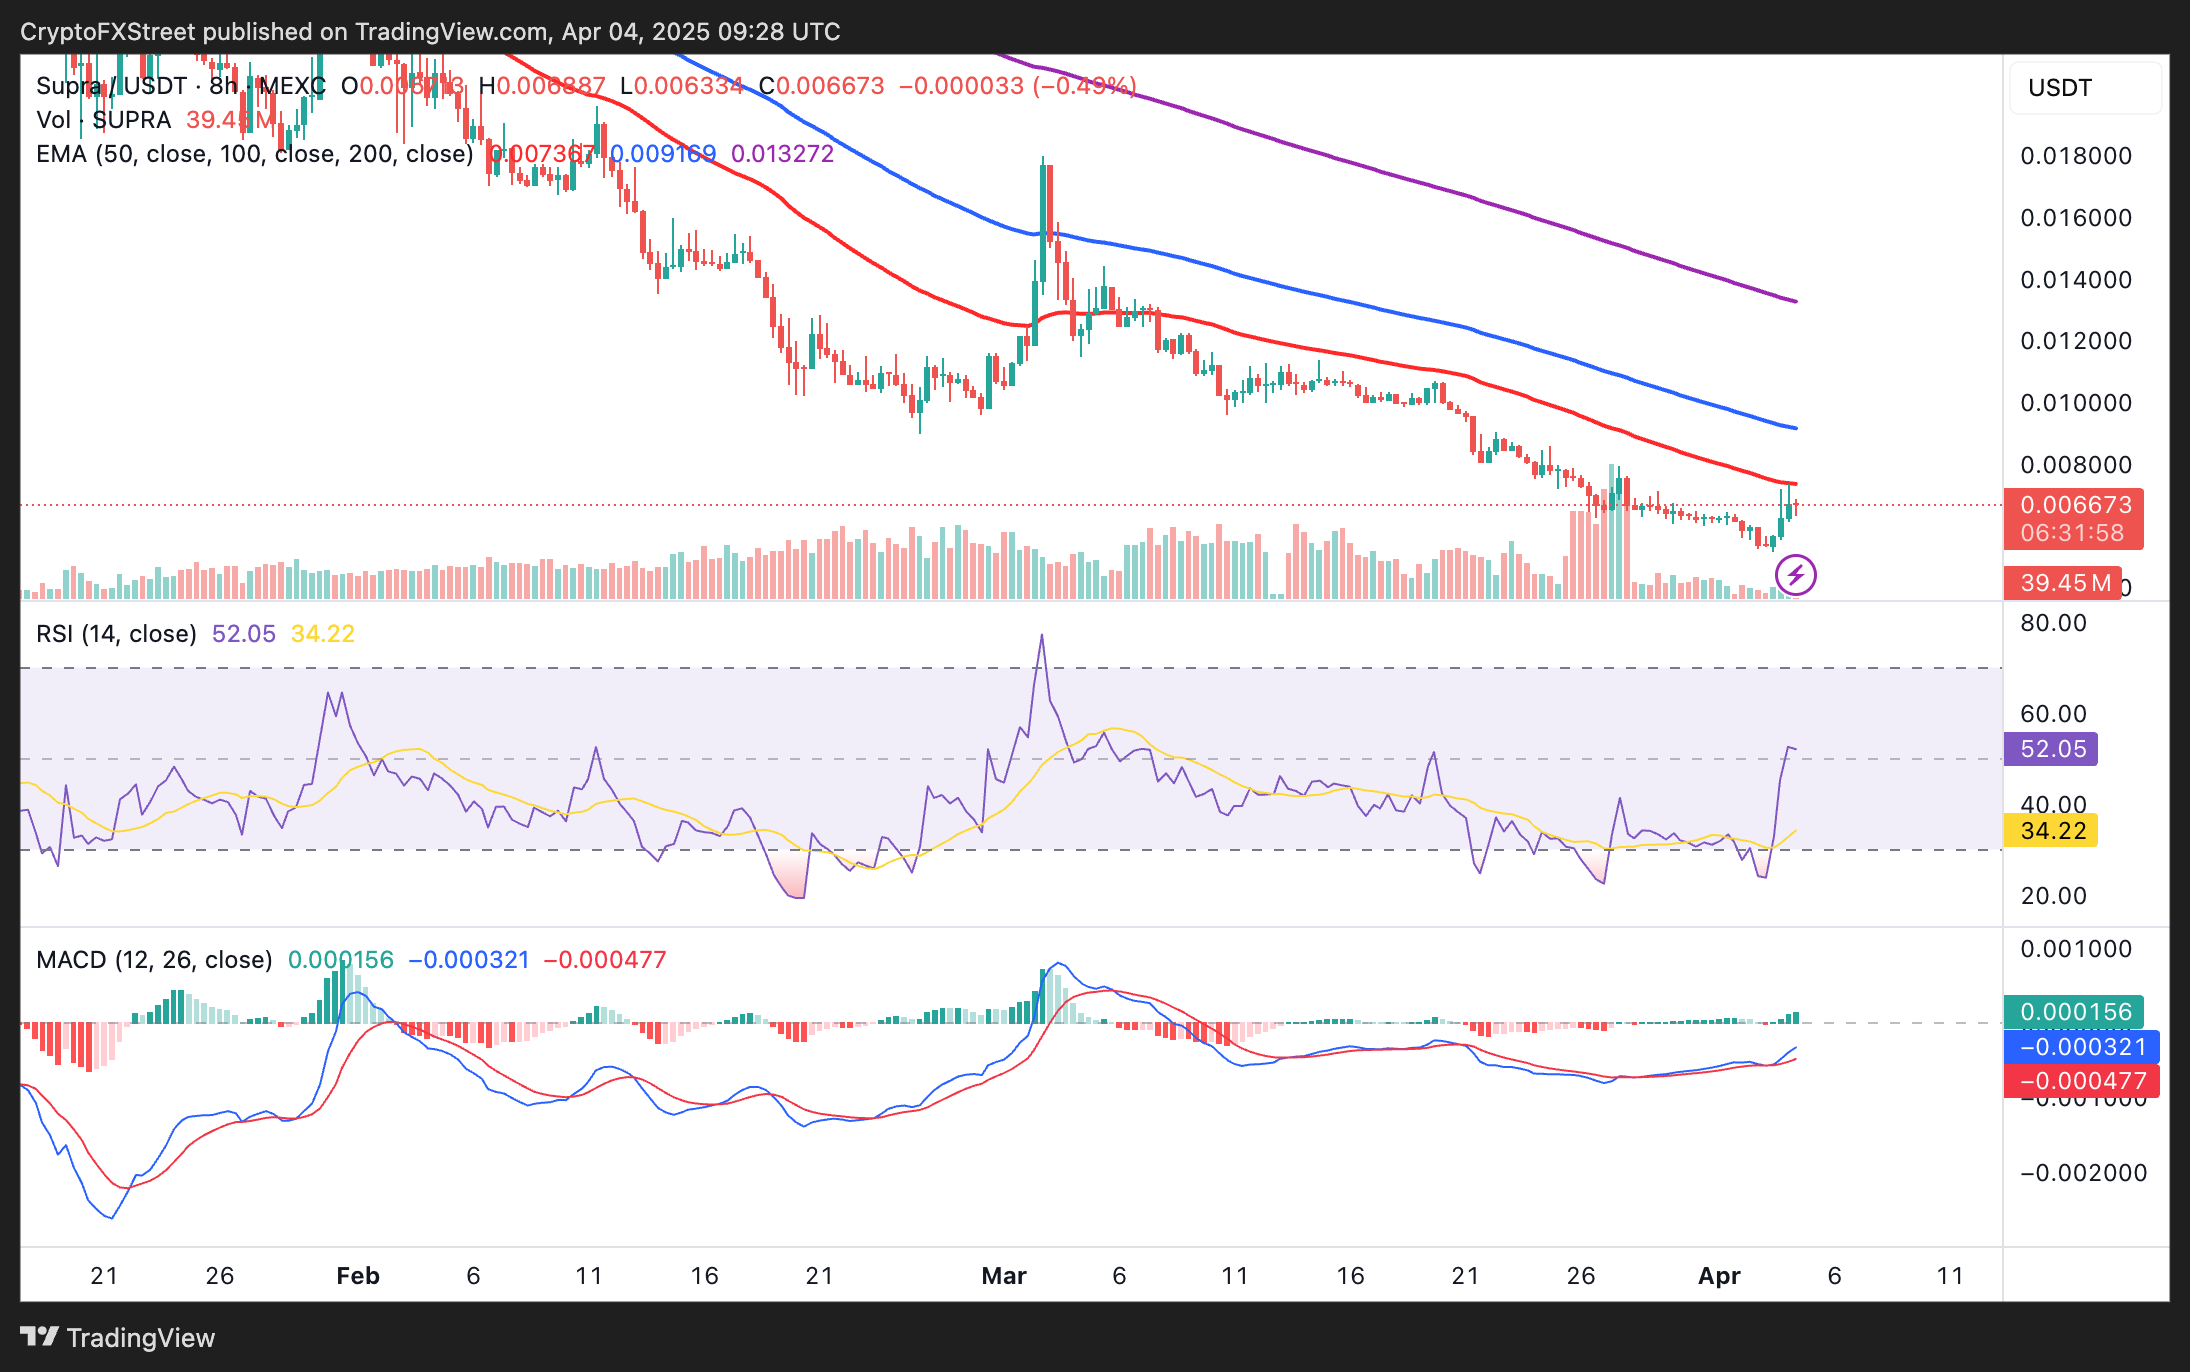
However, the upswing hit a roadblock below the 50 Exponential Moving Average (EMA) in the 8-hour chart, suggesting profit-taking. A break above the 50-EMA, currently near $0.0075, may fuel the uptrend toward $0.0100.
Despite the surge, Supra is generally in a downward trend, which calls for caution among investors interested in trading the token. The Relative Strength Index (RSI) peaked slightly above 50 early Friday but is correcting at 47 in tandem with Supra, targeting support at $0.0060 and the weekly low at $0.0052.

SUPRA/USDT 8-hour chart
Cosmos Hub recovery taps bullish pattern and indicators
Cosmos Hub flaunts two bullish indicators: The RSI and the Moving Average Convergence Divergence (MACD). The RSI’s return from the dip into the oversold area on Wednesday encouraged more traders to seek exposure on ATOM. A buy signal later validated this when the MACD line (blue) crossed above the signal line (red) while histograms flipped from red to green.
ATOM sits above the 50-EMA, the 100-EMA and the 200-EMA in the 4-hour chart. If bulls break the resistance at $5 (shown in red), the inverse head and shoulders (H&S) technical pattern may be confirmed, further accentuating recovery toward $10.
It is important to watch out for a potential retracement, especially if ATOM slides below the moving averages. With that in mind, support levels at $4.4 and $4.2 will come in handy, not to forget the area at $3.6 in case of a major pullback.
Can EOS sustain bullish structure?
EOS shot into the limelight on March 18 when the protocol announced a strategic move to pivot toward offering Web3-centered financial services. As reported, the team announced key financial network pillars, including wealth management, consumer payments, portfolio investment, and insurance. EOS is keen on having Bitcoin at the core of its ecosystem to ensure that it is building for scale, compliance, and speed.
EOS’s pivot to Vaulta amid the uncertainty caused by President Trump’s trade war has put the token on the map, boosting its performance in the market.
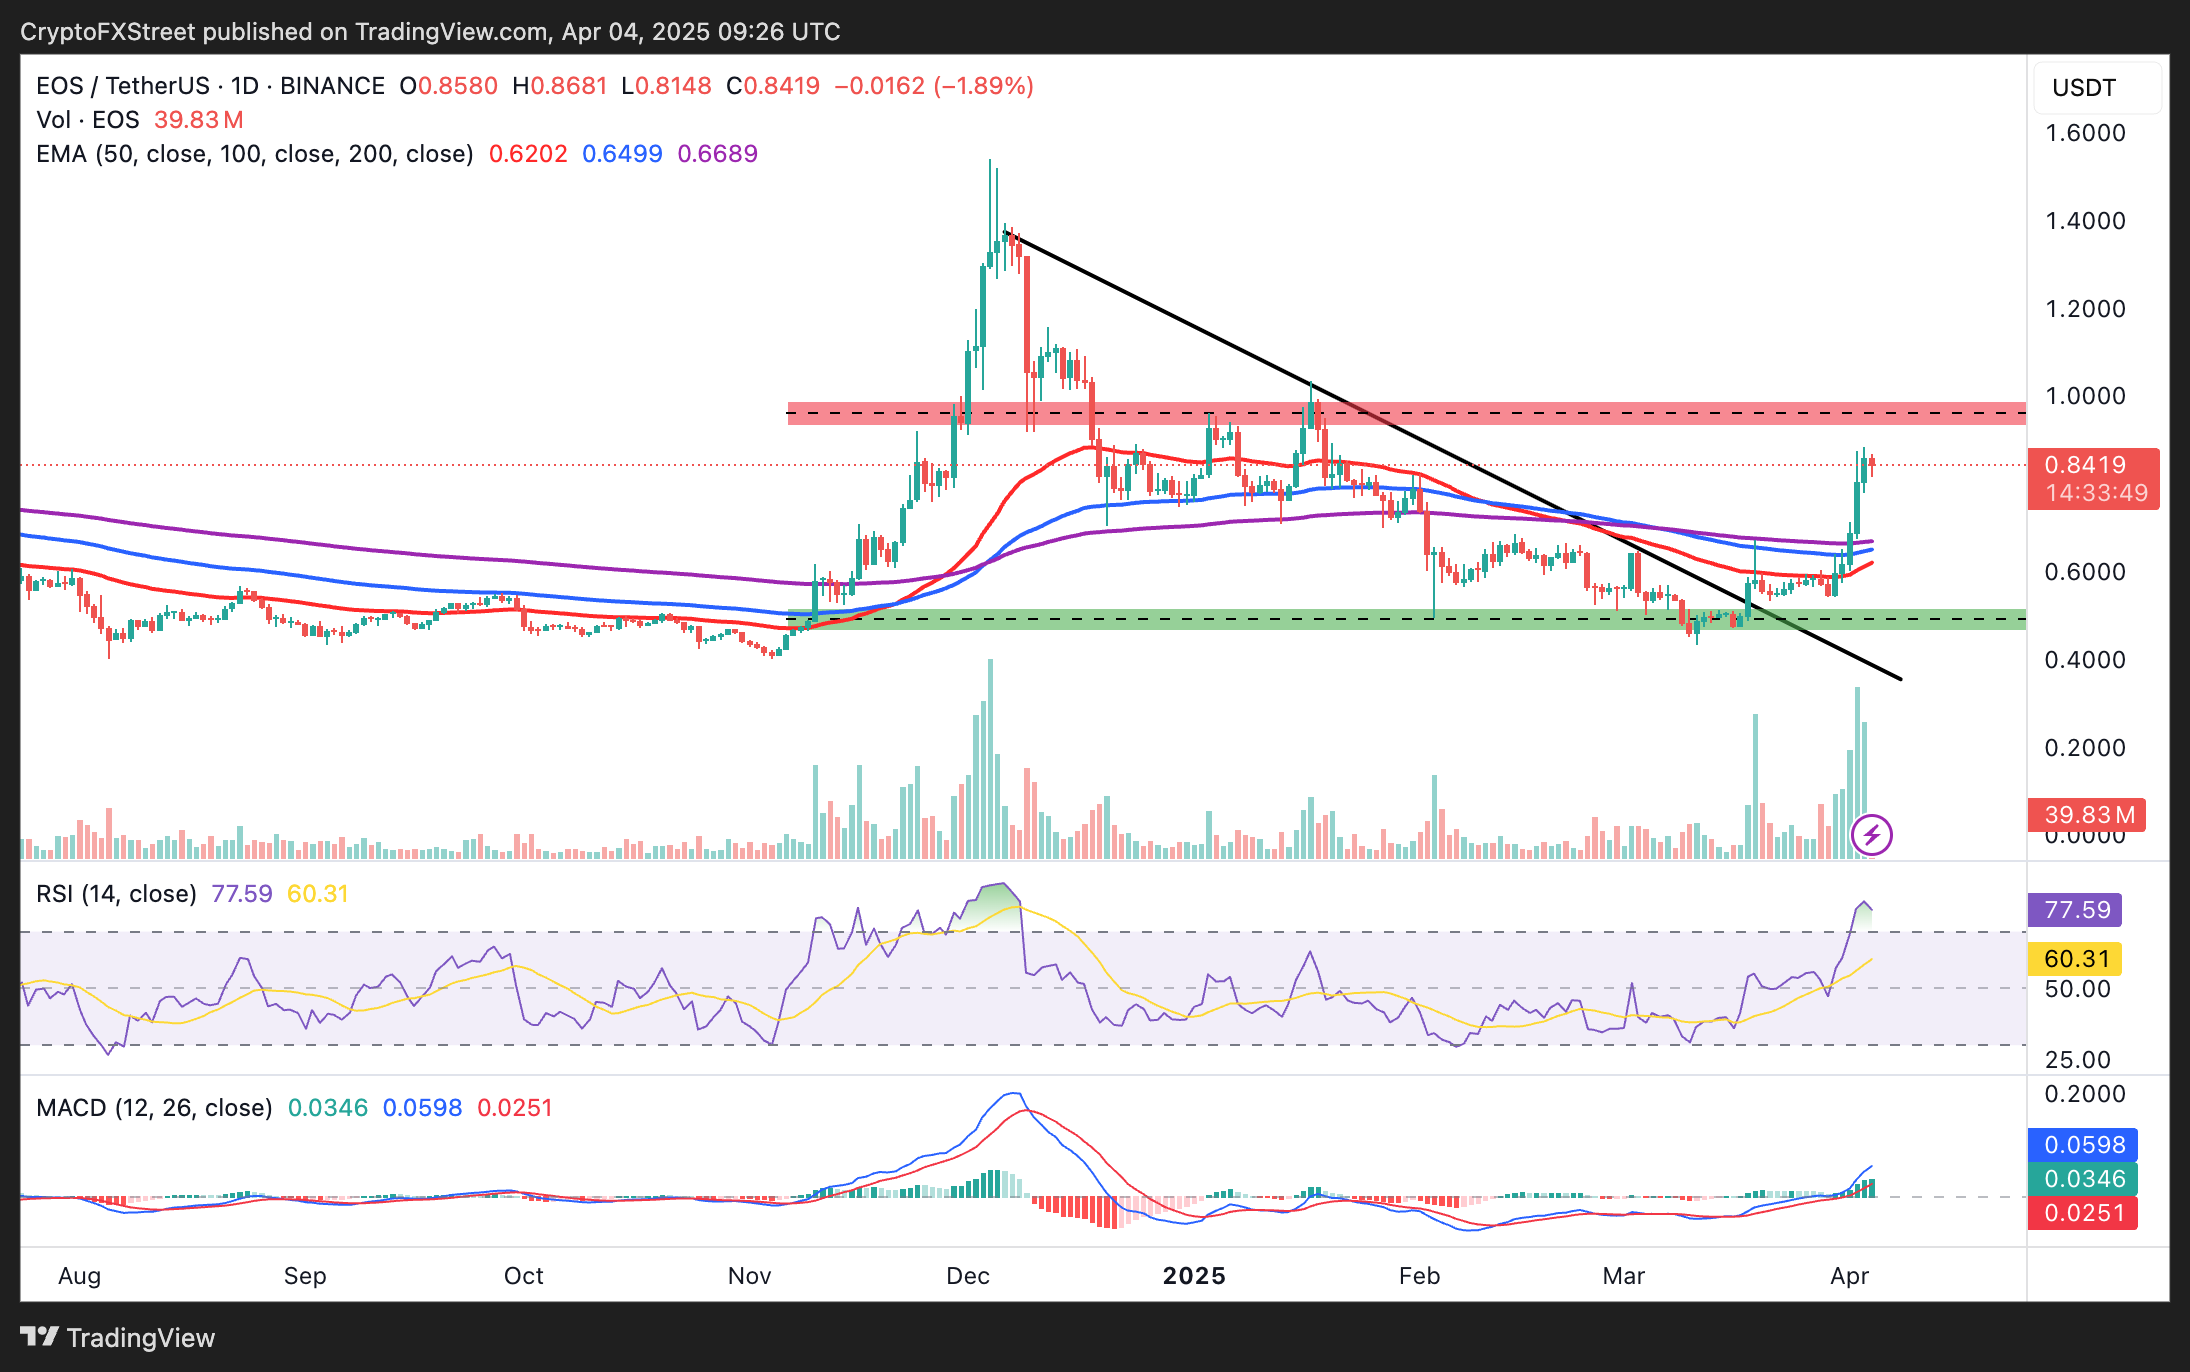
In addition to breaking above a four-month bearish trendline, EOS surged, reaching $0.8846 on Thursday for the first time since January 19.

EOS/USDT daily chart
At the time of writing, EOS has retreated to trade at $0.801944 on Friday. Further correction is expected as the overbought RSI slides into neutral territory. Traders should consider support at $0.0.7000, the 200-day EMA at $0.66891, and the area marked green at around $0.5000.

