
Bitcoin Weekly Forecast: Tariff ‘Liberation Day’ sparks liquidation in crypto market
- Bitcoin price remains under selling pressure around $82,000 on Friday after failing to close above key resistance earlier this week.
- Donald Trump’s tariff announcement on Wednesday swept $200 billion from total crypto market capitalization and triggered a wave of liquidations.
- US Bitcoin spot ETFs recorded a total net outflow of $107.81 million until Thursday.
Bitcoin (BTC) price remains under selling pressure and trades near $84,000 when writing on Friday after a rejection from a key resistance level earlier this week. Volatility in the crypto market was fueled by United States (US) President Donald Trump’s tariff announcement on Wednesday, which has swept $200 billion from total market capitalization and triggered liquidations in the market. The US Bitcoin Spot Exchange Traded Funds (ETFs) recorded a total net outflow of $107.81 million until Thursday, signalling weakness in institutional demand.
Tariffs announcement bring volatility and sweep $200 billion from the crypto market
Bitcoin price saw a spike in volatility as President Trump announced tariffs on 185 countries at once on the so-called “Liberation Day” on Wednesday.
The news began with the Wall Street Journal report that the US would impose a 10% baseline tariff. While this was true, markets took it as ‘ALL’ reciprocal tariffs were 10%. Due to this, the US equity market saw a sharp rise, followed by the crypto market, with BTC reaching a high of $88,500 on Wednesday. However, both equities and the crypto market took a U-turn at 4:26 PM ET when President Trump picked up the tariff poster on stage at his announcement.
“Before he picked up this poster, futures were up +2%. By 4:42 PM ET, futures had fallen -4% from their high as Trump listed new tariffs name by name,” says The Kobessi Letter report.
The tariffs were calculated at half of the rate at which countries are currently charging the US. As for reference, China, which the US claims, currently charges 67% tariffs. This means a 34% tariff is coming for China and 20% for the European Union, which is clearly much more than the 10%.
This news triggered volatility in the crypto market as BTC declined from its high of $88,500 to its low of $82,320 on Wednesday, wiping $200 billion from the total crypto market cap and $178.72 million in liquidations on BTC, as shown in the graph below.
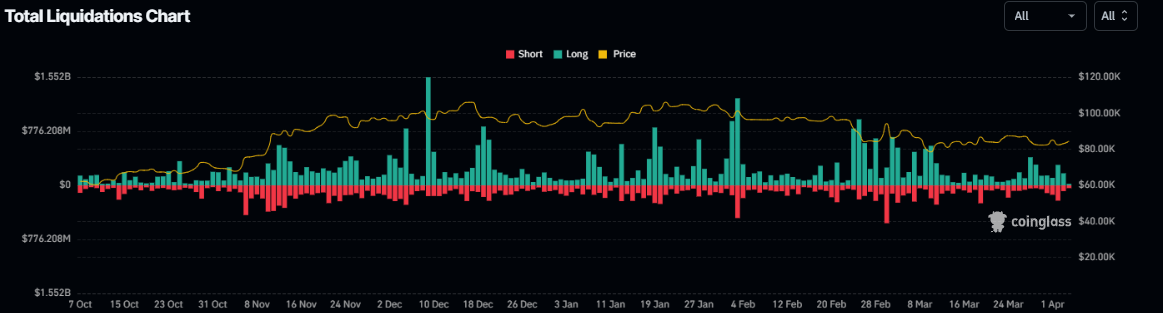
Total Liquidation chart. Source: Coinglass
The CryptoQuant weekly report highlights anticipated market turbulence due to Trump’s tariff announcement. Investors rushed to transfer Bitcoin to exchanges, with a single block recording as much as 2,500 BTC. In the US, Coinbase also saw a notable uptick in Bitcoin deposits, especially from large holders, as shown in the graph below.
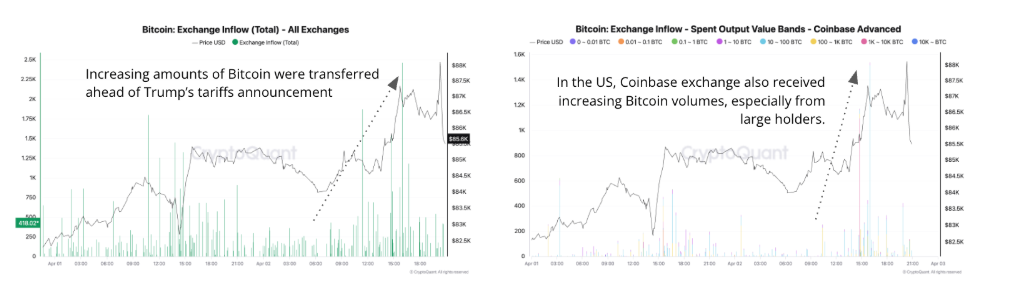
Bitcoin: Exchange Inflow all exchanges (Left chart). Bitcoin Exchange Inflow coinbase advance (Right chart). Source: CryptoQuant
The report further explains that the total open interest in Bitcoin declined to 304,000 from 334,000 BTC, implying the close of long positions as Trump announced tariffs. Falling open interest during a price drop typically signals that traders are exiting long positions, either in anticipation of further declines or due to liquidations.
The CryptoQuant’s Bull Score Index is currently at 20, its lowest reading since then. This indicates a weak investment environment and diminishes the likelihood of a sustained rally in the near term. If the score remains below 40 for an extended period, it could signal continued bearish market conditions, similar to previous bear market phases.
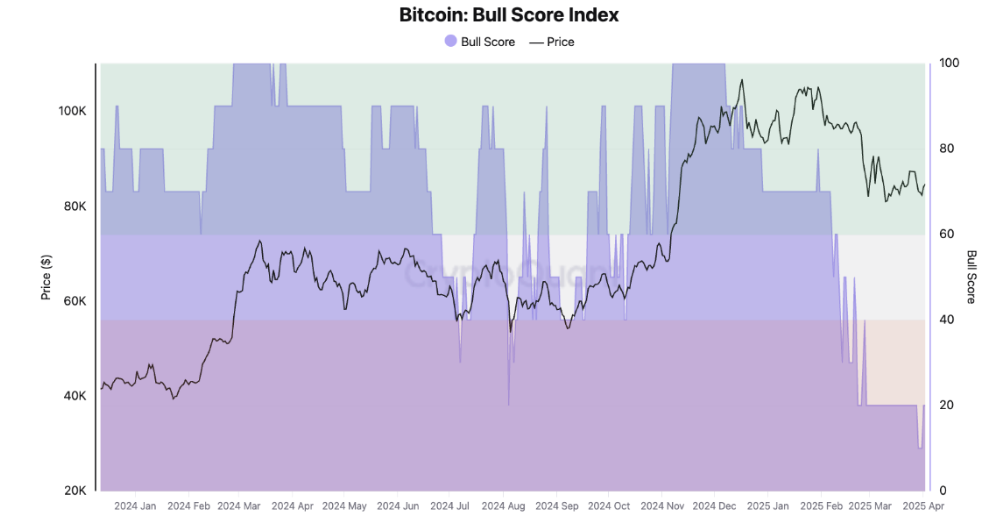
Bitcoin Bull score index. Source: CryptoQuant
Institutional demand shows weakness
Institutional demand weakens as uncertainty arises in the market this week. According to the SoSoValue data, the US spot Bitcoin ETF recorded a net outflow of $107.81 million until Thursday. The data further shows that the weekly netflow has been weak since mid-February, one month after Donald Trump’s inauguration on January 20. If the net outflow continues and intensifies, Bitcoin's price could see further correction ahead.
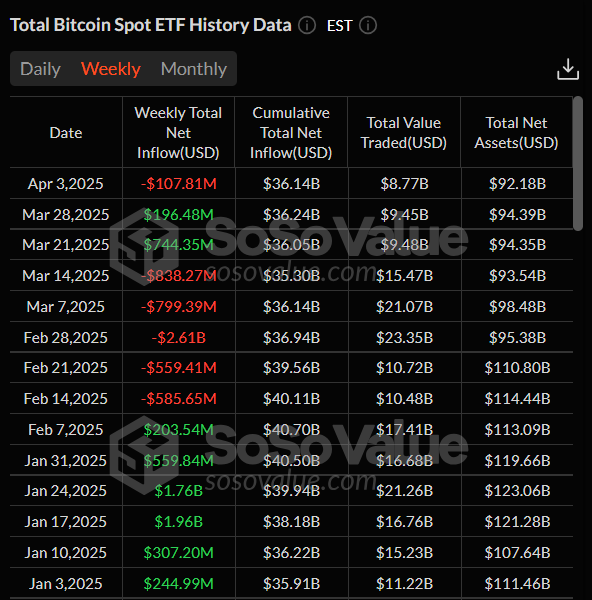
Total Bitcoin Sport ETF weekly chart. Source: SoSoValue
Despite the weakening institutional demand, public companies increasingly convert their balance sheets into Bitcoin reserves.
As explained in the earlier report, Gamestop (GME) has raised $1.5 billion in capital, with potential plans to allocate part of the funds toward expanding its Bitcoin treasury. Metaplanet (MTPLF) added 160 BTC to its holdings on Tuesday, bringing its total to 4,206 BTC. Meanwhile, Bitcoin mining firm MARA Holdings (MARA) is preparing a $2 billion stock offering to acquire more Bitcoin, signalling growing institutional interest in crypto assets.
This trend is generally bullish for Bitcoin’s price due to increased demand, reduced circulating supply, and positive market sentiment. If this trend continues, Bitcoin could see more stable price growth over the long term, but short-term fluctuations are likely to persist as the market adjusts to this new wave of institutional involvement.
Market awaits US agencies' Strategic Bitcoin Reserve report
A K33 Research report, ‘The Forgotten Reserve’, explains that lost somewhere underneath tariff headlines, federal agencies are scheduled to submit reports by Saturday outlining their authority to transfer digital assets to the Strategic Bitcoin Reserve (SBR). This brings a clear and closer clarification of the reserve’s initial composition and value.
“We expect the Bitfinex funds (94,636 BTC) to be transferred to the exchange following this deadline,” says a K33 Research analyst.
The analyst continued, “Volatility may follow such a transfer, especially since headlines still reference the total US Gov. BTC holdings of ~200K BTC in relation to the SBR.” The analyst expects BTC to extend its consolidation and hover in the $75,000 to $88,000 range.
Is BTC out of the woods?
Bitcoin was rejected by the 50% Fibonacci retracement (drawn from its November low of $66,835 to its all-time high of $109,588 in January) at $88,211 and declined 3.10% on Wednesday. Moreover, BTC failed to close above its daily resistance level of $85,000. This daily level coincides with the 200-day Exponential Moving Average (EMA) and a descending trendline, making it a key resistance zone. BTC stabilized at around $83,000 the next day and trades slightly below around $82,000 at the time of writing on Friday.
The Relative Strength Index (RSI) indicator on the daily chart reads 44 after being rejected from its neutral level of 50 on Tuesday, indicating slight bearish momentum. If the RSI continues to slide downwards, the bearish momentum will increase, leading to a sharp fall in the BTC price.
The Moving Average Convergence Divergence (MACD) lines coil against each other, indicating indecisiveness among traders.
If BTC continues to find rejection from the daily resistance at $85,000, it could extend the decline to retest its next support level at $78,258.
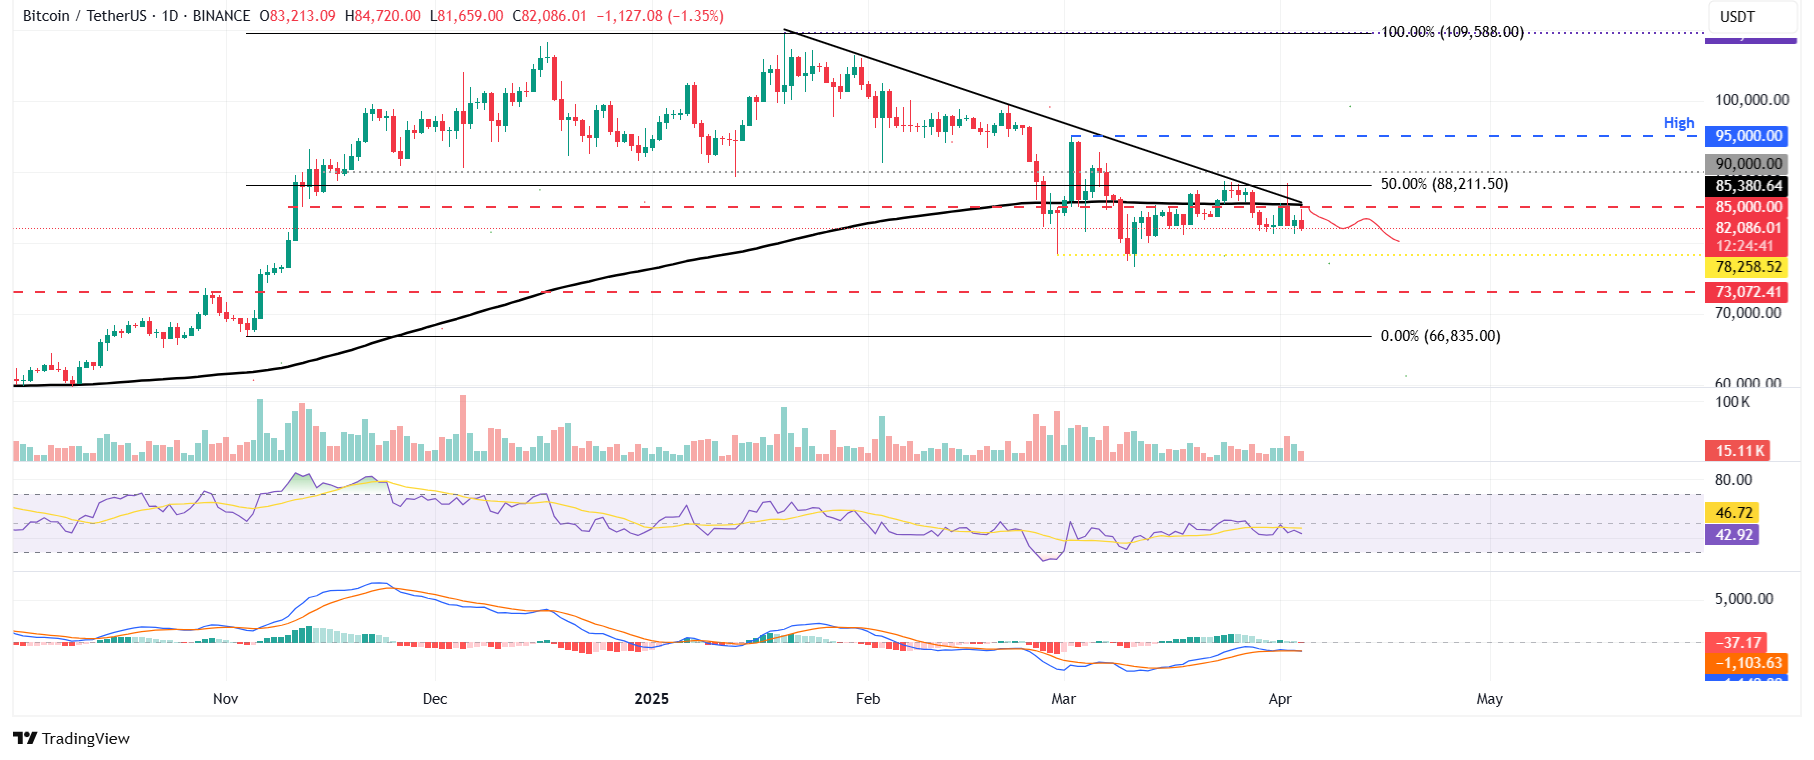
BTC/USDT daily chart
However, if BTC recovers and closes above its daily resistance at $85,000, it could extend the recovery rally to the key psychological level of $90,000.
추천 기사


