
Bitcoin whale demand surges by $13B over three days
- Bitcoin price rose 4% to hit a 10-day peak of $85,900 on Wednesday as the Federal Reserve's rate pause decision aligned with market expectations.
- IntoTheBlock’s on-chain chart shows that BTC large transactions increased by $13 billion since the start of the week.
- Bitcoin ETFs saw over $500 million inflows in the three days leading up to the US Fed meeting.
Bitcoin (BTC) price hits 10-day peak after Fed meeting
Bitcoin (BTC) broke above key support levels after the US Fed announced a rate pause, aligning with market expectations. Following cooler-than-expected inflation signals in the CPI and PPI data published earlier in the month, market watchers priced in a high-chance of a rate pause.
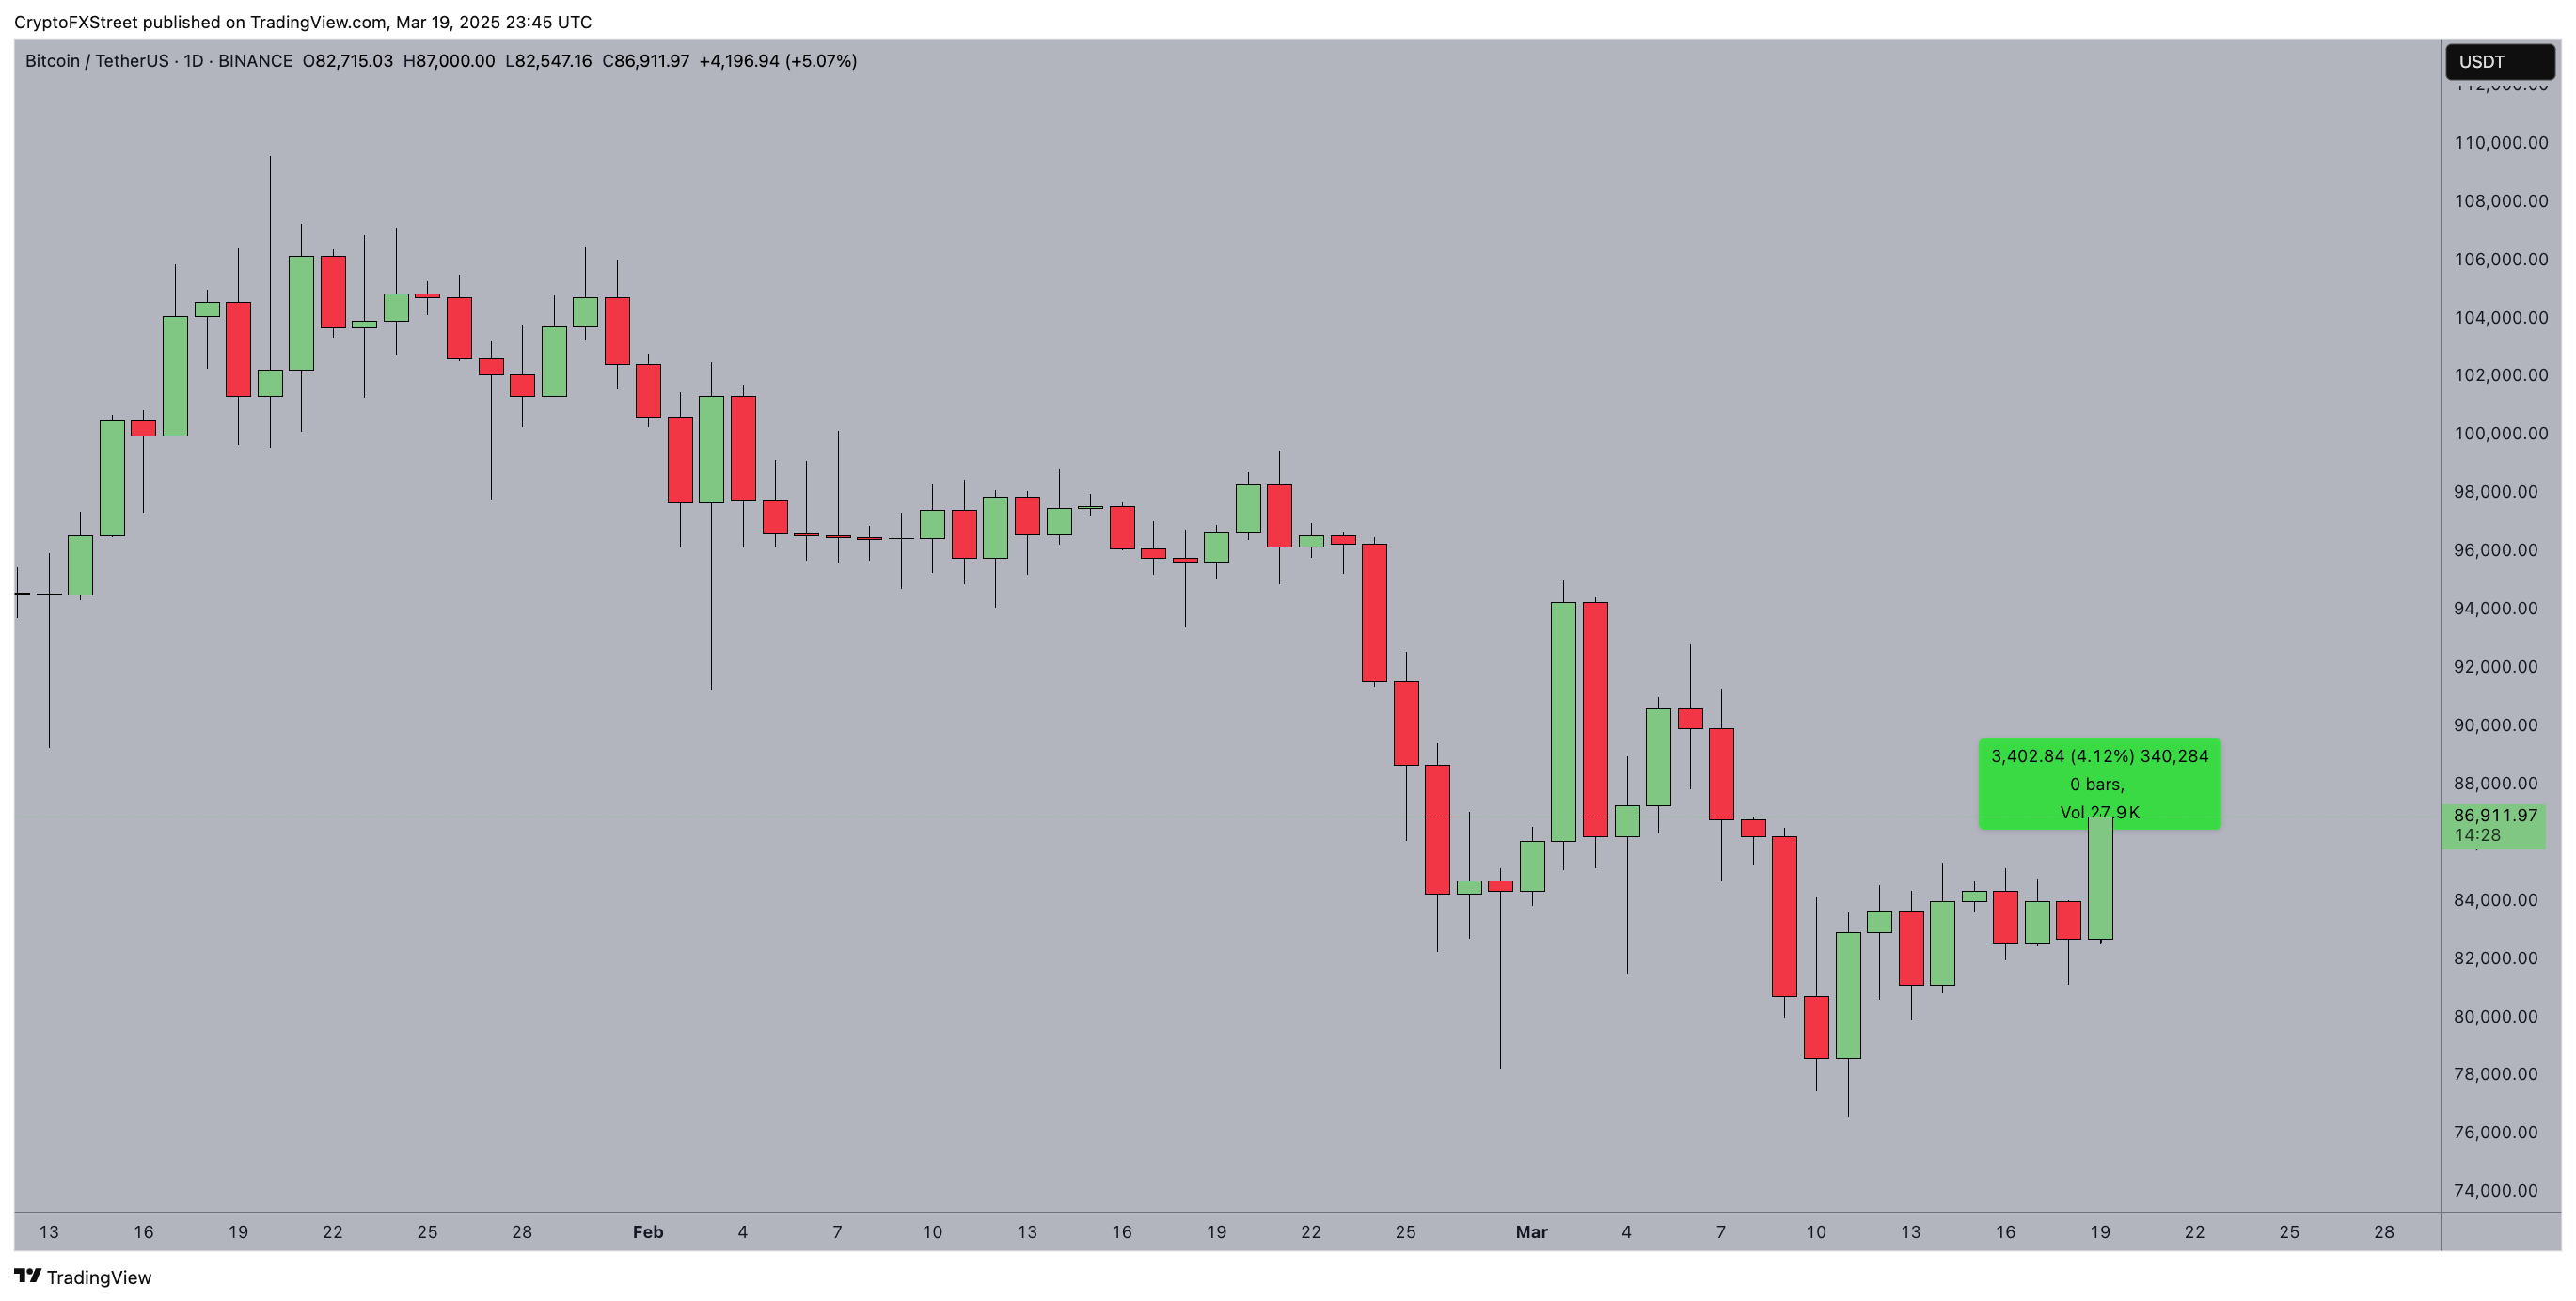 Bitcoin price action | BTCUSDT
Bitcoin surged 4% on Wednesday, climbing to a 10-day high of $85,900 as the US Fed rate decision macroeconomic conditions and positive sentiment from SEC dropping charges against Ripple both provided dual catalysts for a market-wide rally.
Bitcoin ETFs see $500M inflows as whale demand surges $13B ahead of Fed meeting
While Bitcoin price only climbed 4% on Wednesday other vital fundamental indicators are pointing towards increased whale accumulation ahead of the Fed rate decision. First, after experiencing a three-week selling streak, Bitcoin ETFs reversed course this week, recording $512 million in cumulative inflows in the last three trading days, according to data from SosoValue.
On Wednesday alone, Bitcoin ETFs attracted $209 million in net inflows, after taking in $32 million and $274 million earlier in the week. Notably, this marks the first time since January 31, that Bitcoin ETFs have entered three consecutive days of positive netflows.
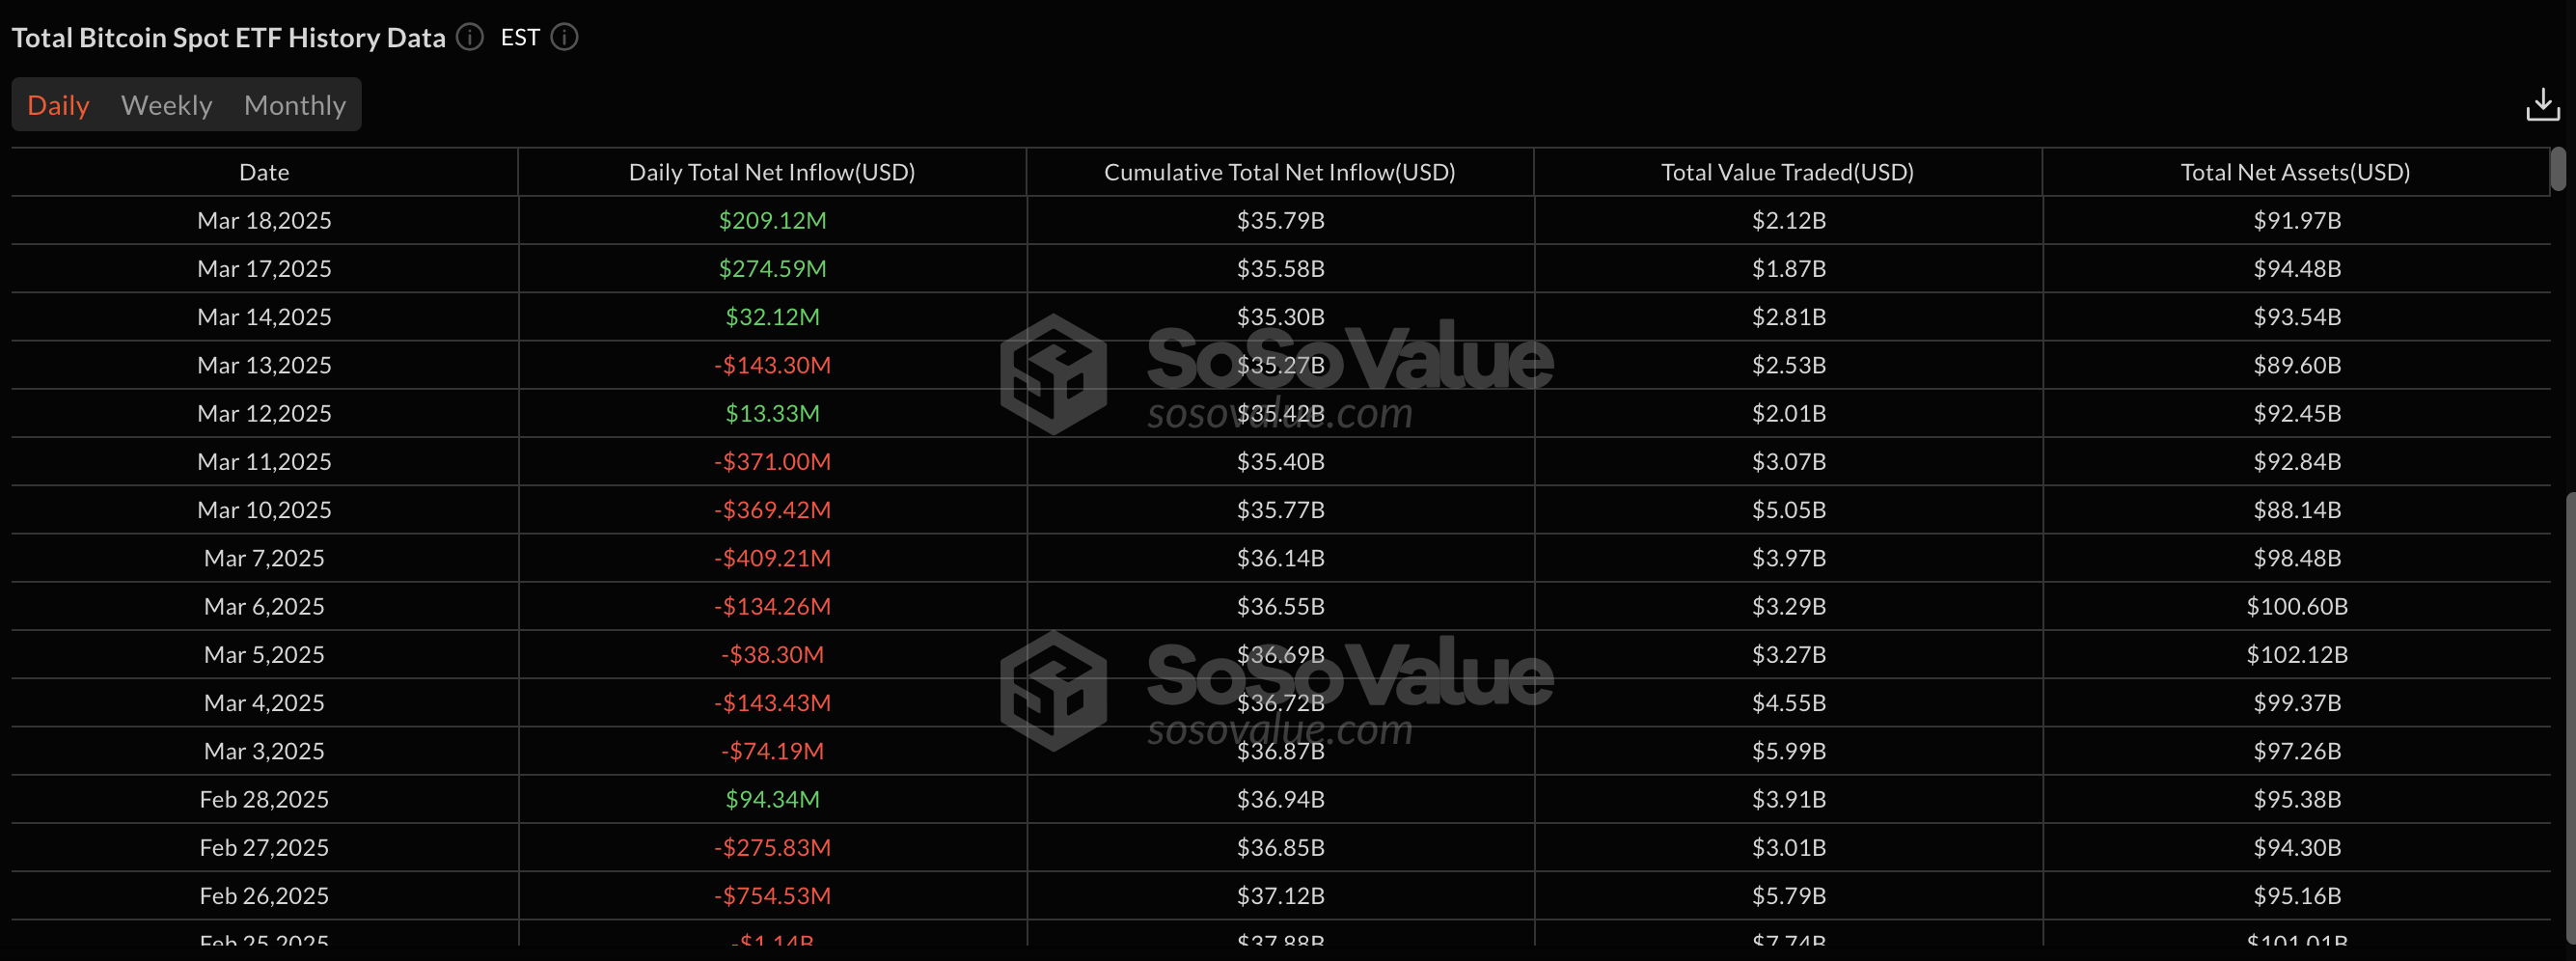
Bitcoin ETF Flows | SosoValue
Furthermore on-chain data from IntoTheBlock also confirms that Bitcoin whales increased that buy pressure significantly in the days preceding the Fed rate cut.
The BTC Large Transactions chart below tracks the total value of Bitcoin transactions that exceed $100,000 in a single day. The provides real-time data on the amount of capital deployed by whale traders and large corporate investors around key market events.
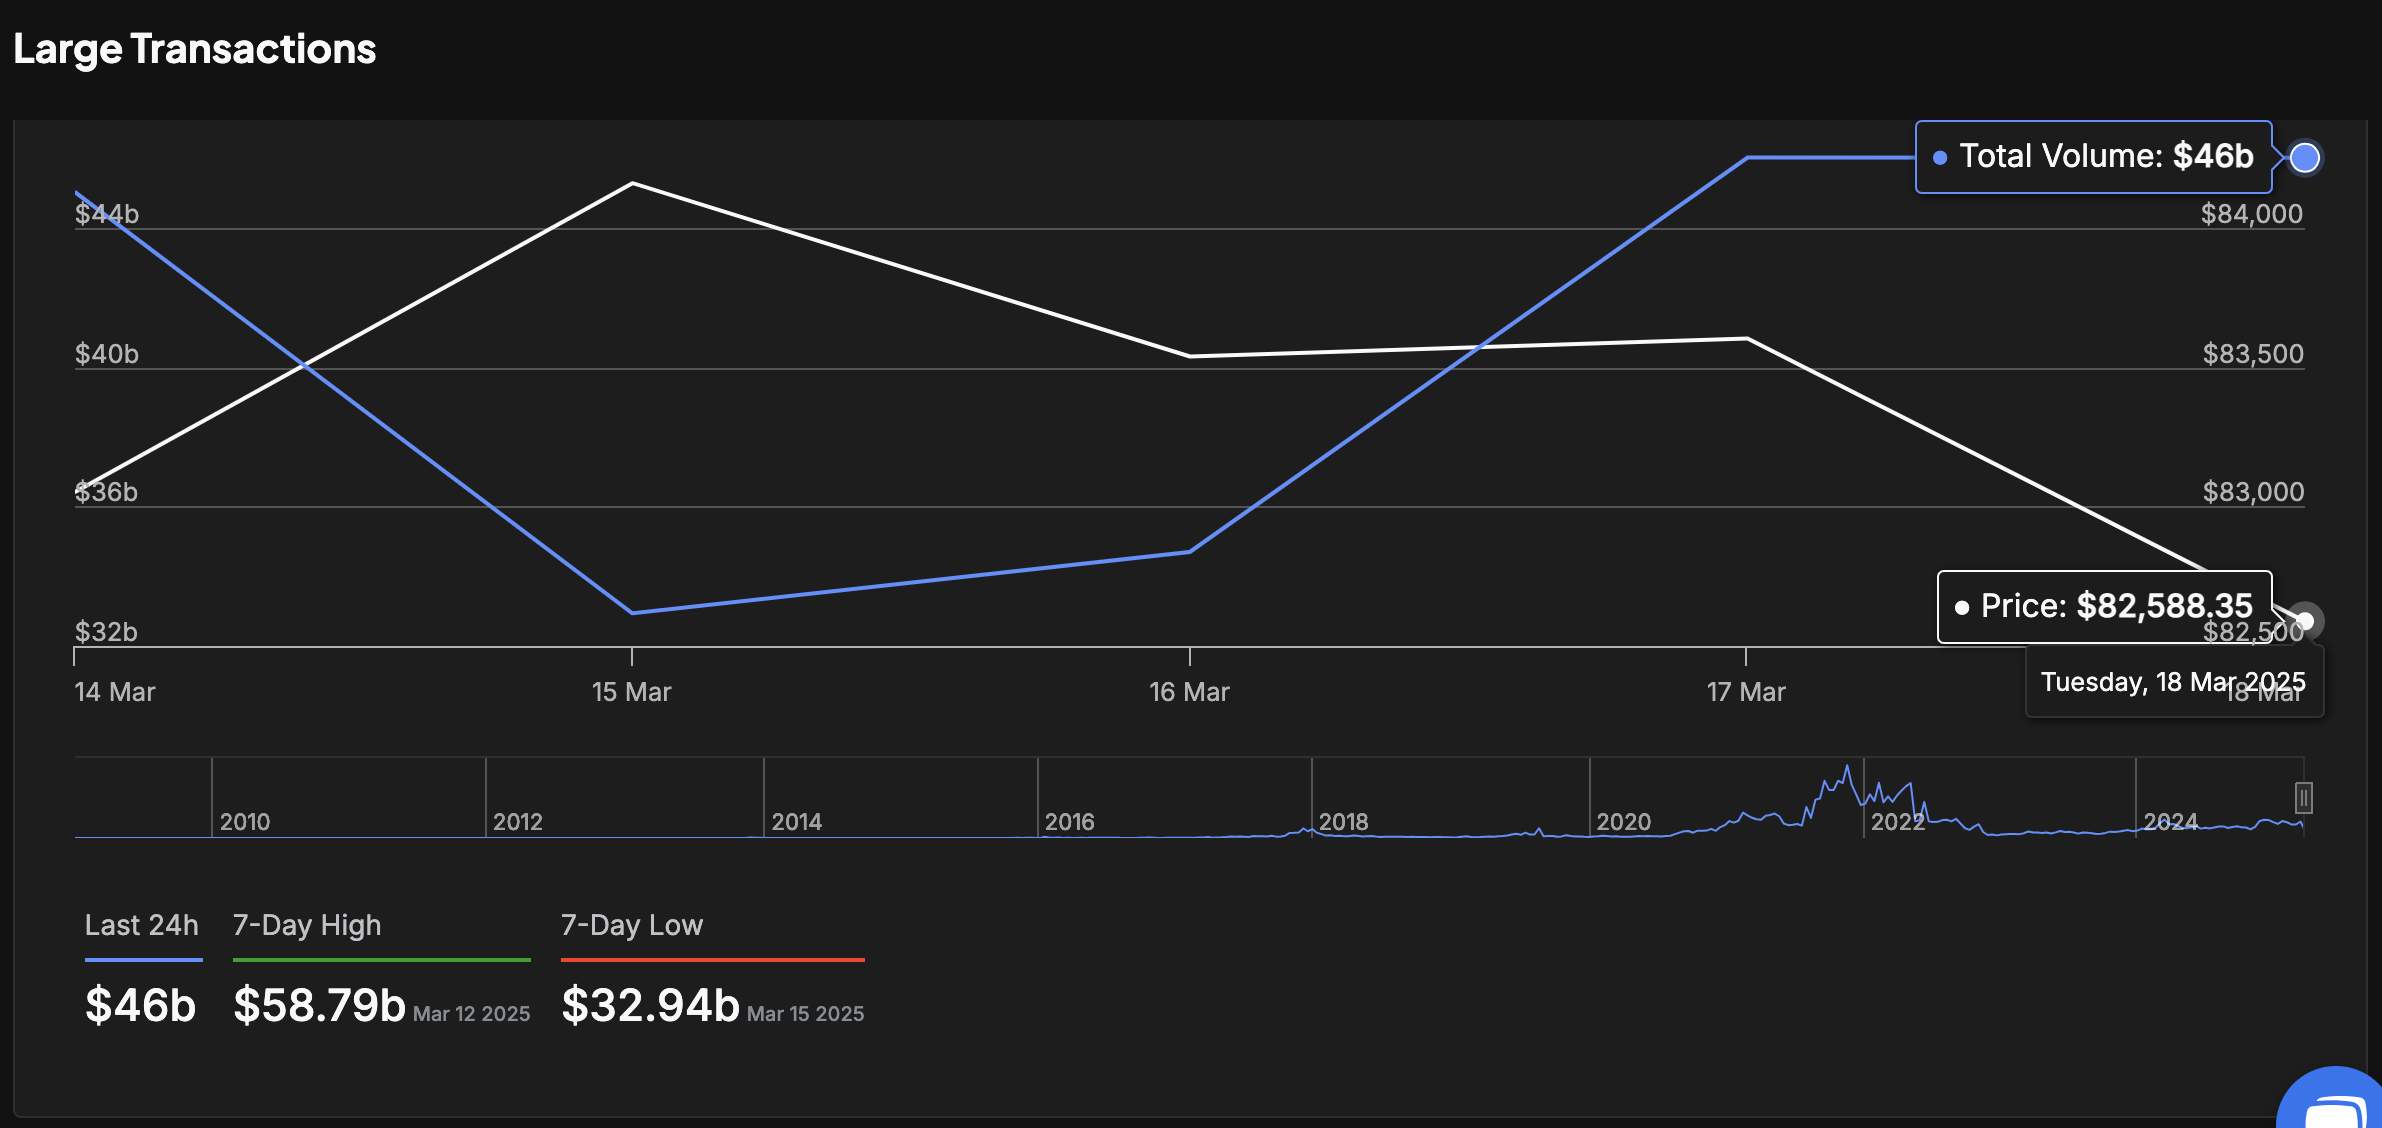
Bitcoin Whale Transaction volumes rise $13 billion ahead of US Fed Meeting | Source: IntoTheBlock
As seen above Bitcoin only recorded a $32 billion large transactions at the start of the week on March 15.
But since then BTC large transactions have risen 40% to hit $42.9 billion as of Wednesday.
This shows that BTC whales’ demand increased by $13 billion ahead of the US Fed rate decision.
Bitcoin price forecast: Sell-the-news triggers could trigger pull-back to $80K
Bitcoin’s 4% rally on Wednesday was accompanied by strong whale demand.
However, when whales make large purchases ahead of a key market event, as observed in Bitcoin markets this week, it often raises the risk of a sell-the-news strategy in play.
If the large investors opt to execute strategic exits, Bitcoin price could enter a sharp correction phase in the coming trading sessions.
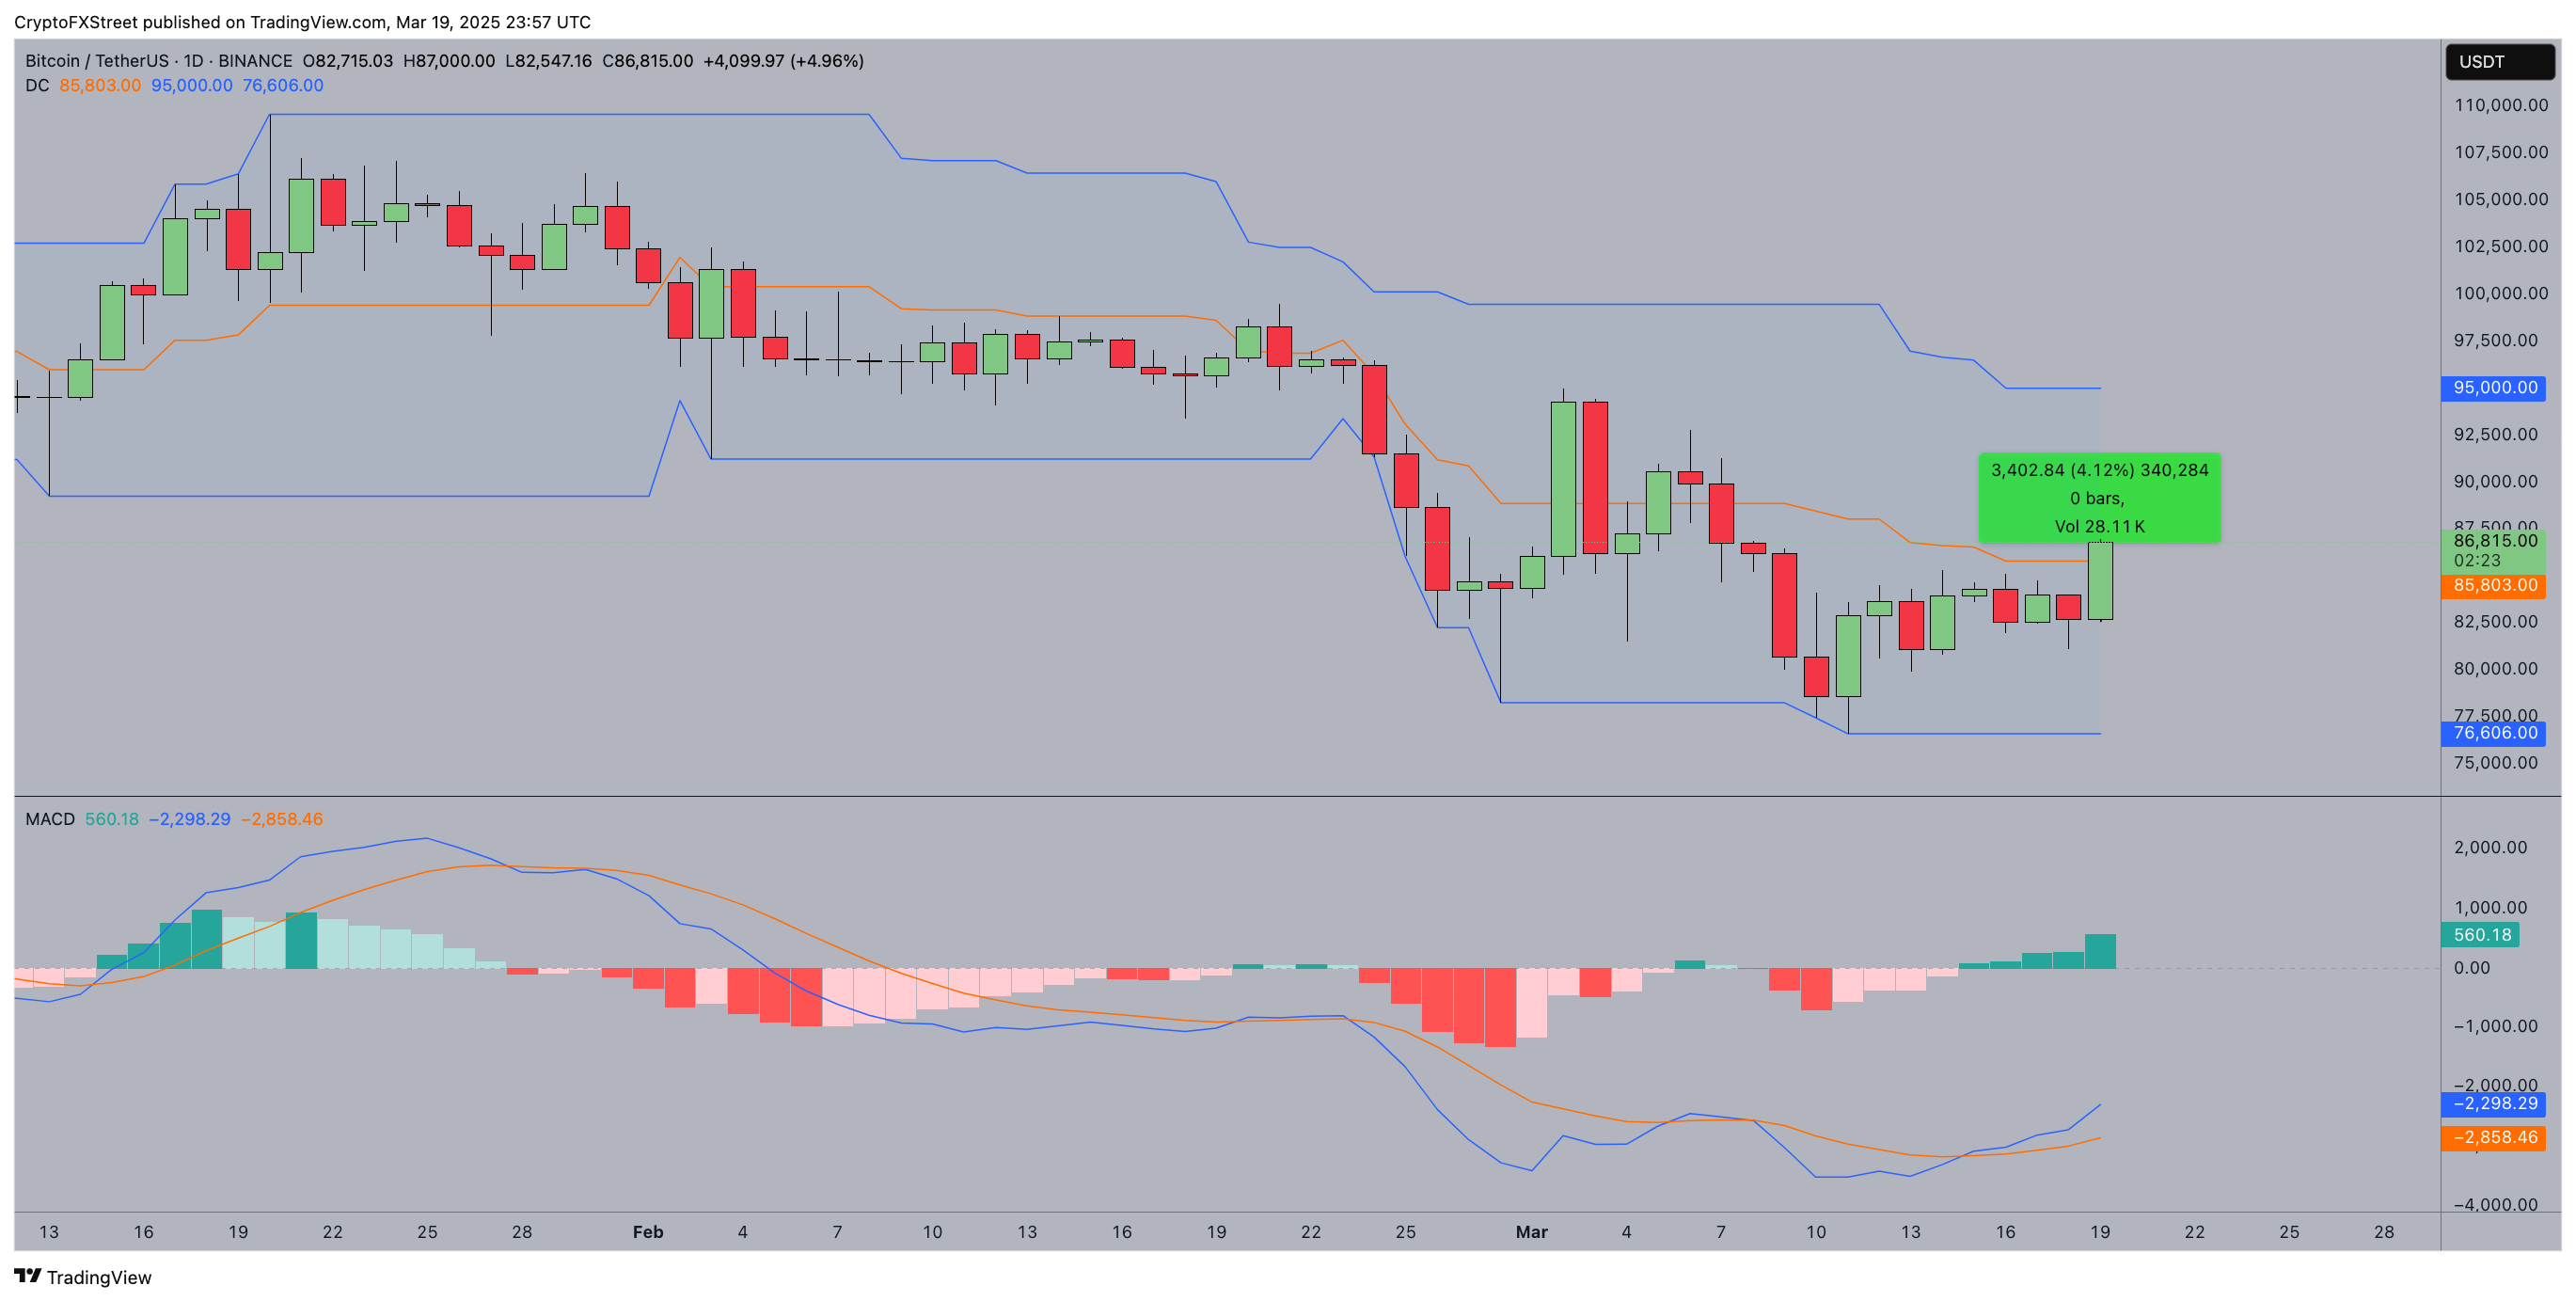
Bitcoin price forecast | BTC
However, Bitcoin’s short-term momentum remains dominantly positive, as evidenced by the Moving Average Convergence Divergence (MACD) indicator in the chart above.
The MACD histogram has flipped green, confirming a shift in momentum toward the upside, while the MACD line is approaching a bullish crossover above the signal line.
This pattern typically signals the potential for extended gains if buying pressure remains consistent.
More so, BTC’s price has broken above the middle band of the Donchian Channel at $85,803, suggesting bullish dominance as it targets the upper band resistance near $96,000.
Conversely, if Bitcoin fails to breach the $90,000 psychological resistance, profit-taking by whales and short sellers could spark a retracement.
The MACD’s negative values indicate residual bearish pressure, while the lower Donchian Channel boundary at $76,606 remains a crucial downside target.
추천 기사


