
Bitcoin Price Forecast: BTC standoff continues
- Bitcoin price has been consolidating between $94,000 and $100,000 since early February.
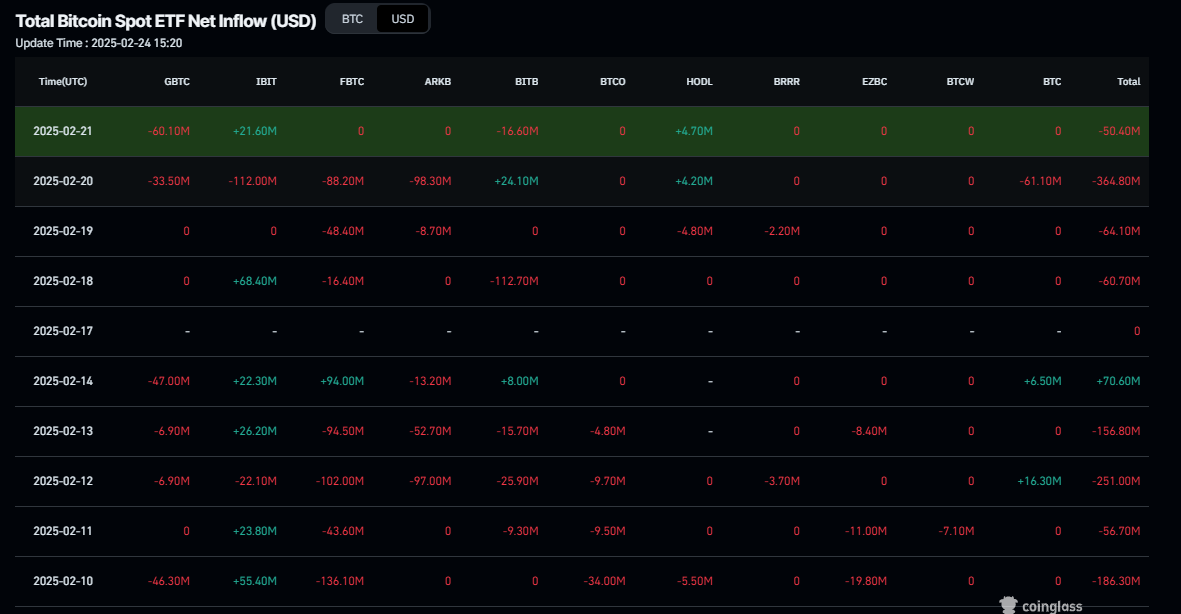
- US Bitcoin spot ETF data recorded a total net outflow of $540 million last week.
- QCP’s report explains Bybit’s ability to swiftly secure a bridge loan to cover the liquidity gap after its recent hack worth $1.4 billion on Friday.
Bitcoin (BTC) has been consolidating between $94,000 and $100,000 since early February. Amid this consolidation, investor sentiment remains indecisive, with US spot Exchange Traded Funds (ETFs) recording a $540 million net outflow last week, signaling institutional demand weakness. At the same time, QCP’s report explains Bybit’s ability to swiftly secure a bridge loan to cover the liquidity gap after its recent hack worth $1.4 billion on Friday.
Bitcoin price weakens amid Bybit $1.4 billion hack
Bitcoin price topped $99,475 on Friday and declined by over 3% over the weekend, closing at $96,258 on Sunday. This correction was fueled by the news that the Bybit cryptocurrency exchange had been compromised, and funds worth $1.4 billion had been stolen.
This news triggered a series of liquidations in the crypto market totaling $802.37 million from Friday to Sunday, according to Coinglass data.
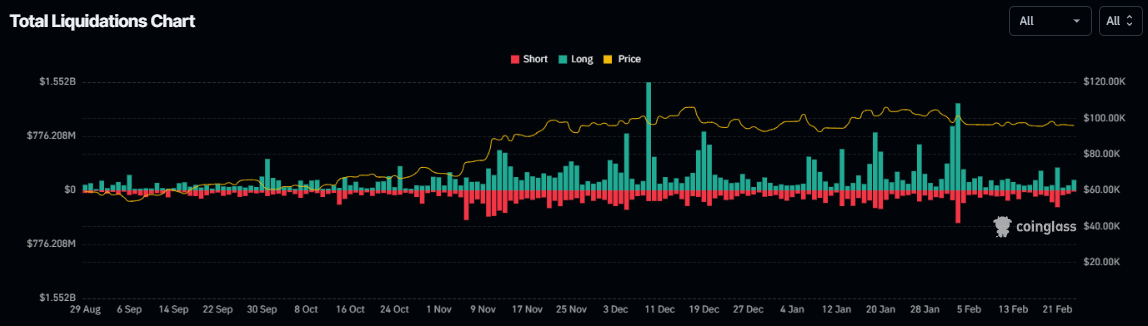
Total Liquidations chart. Source: Coinglass
On Sunday, Bybit posted on X that its deposits and withdrawals had fully recovered to normal levels, as confirmed by on-chain data.
Moreover, on Monday, Ben Zhou, CEO of Bybit exchange, explained on his social media platform X that “Bybit has already fully closed the ETH gap; a new audited POR report will be published very soon to show that Bybit is again Back to 100% 1:1 on client assets through Merkle tree.”
According to Lookonchain data, the exchange has received 446,870 Ethereum (ETH) worth $1.23 billion through loans, large deposits, and ETH purchases in the past two days.
QCP’s Capital report on Monday states that “Bybit’s ability to swiftly secure a bridge loan to cover the liquidity gap during a critical period highlights the resilience of the lending space and the ample liquidity available. This sector has steadily recovered since 2022 and experienced a significant spike ahead of last year’s US Presidential election.”
Marc Tillement, Director of the Pyth Data Association, told in an exclusive interview with FXStreet, “The Bybit hack is another wake-up call for the industry, highlighting the ongoing vulnerabilities of CEXs and the inherent risks that are tied to them.”
Tillement continued, “History tends to repeat itself, and security breaches trigger waves of regulatory crackdowns, capital flight from CEXs, and a renewed push for self-custody. The post-FTX era has already made traders hyper-aware of counterparty risk, and this hack could accelerate the migration to DEXs. I firmly believe that crypto’s future belongs to protocols prioritizing security and transparency.”
Fading institutional demand for Bitcoin
Diving down into Bitcoin’s institutional demand, it shows signs of weakness. According to Coinglass, Bitcoin spot ETF data recorded net outflows of $540 million last week, extending the previous week’s $580.2 million withdrawal trend and signaling continued weakness in demand. If the magnitude of the outflow continues and intensifies, the Bitcoin price could see further corrections.
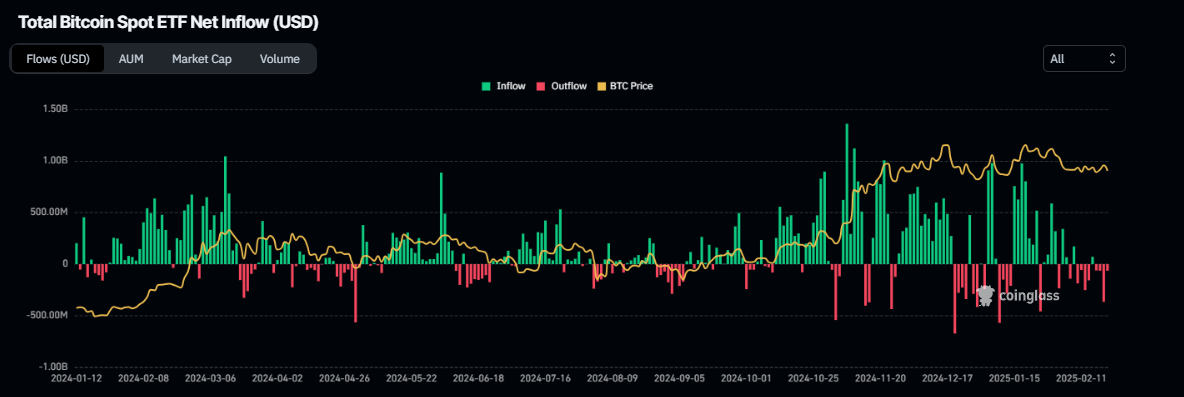
Total Bitcoin spot ETF net inflow chart. Source: Coinglass
Bitcoin Price Forecast: BTC consolidation ending soon?
Bitcoin price has been consolidating between $94,000 and $100,000 for almost three weeks. At the time of writing on Monday, it trades slightly down around $95,700.
If BTC breaks and closes below the lower boundary of the consolidating range of $94,000, it could extend the decline to test its psychologically important level of $90,000.
The Relative Strength Index (RSI) on the daily chart reads 43, below its neutral level of 50 and points downwards, indicating rising bearish momentum. The Moving Average Convergence Divergence (MACD) indicator coils around itself on the daily chart, indicating indecisiveness among the traders.
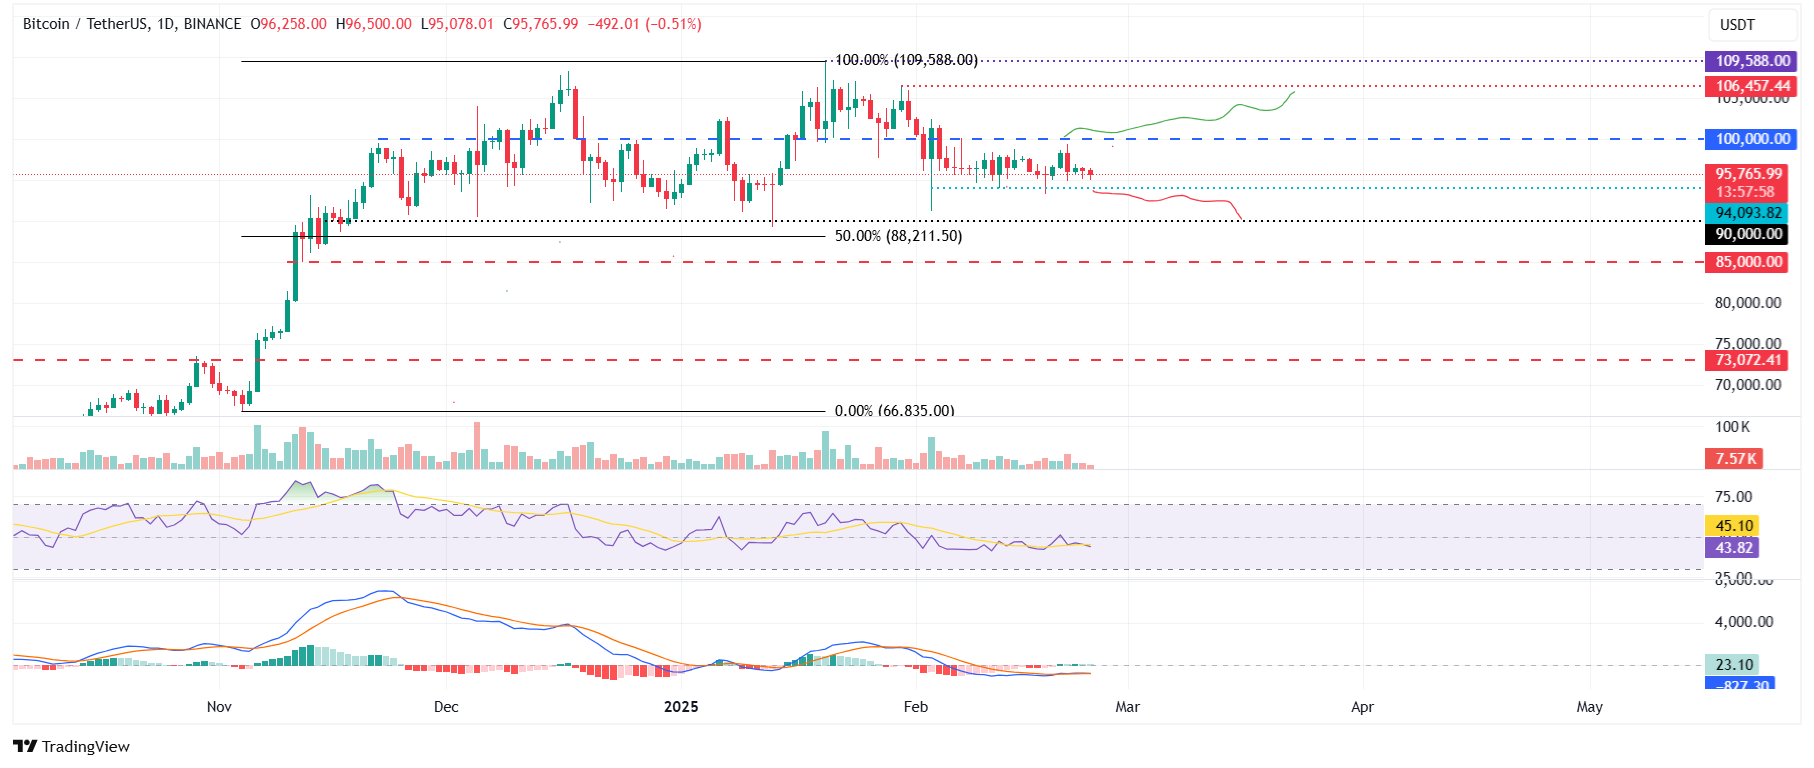
BTC/USDT daily chart
However, if BTC recovers and breaks above the upper boundary of the consolidating range of $100,000, it will extend the recovery to retest its January 30 high of $106,457.
Bitcoin, altcoins, stablecoins FAQs
Bitcoin is the largest cryptocurrency by market capitalization, a virtual currency designed to serve as money. This form of payment cannot be controlled by any one person, group, or entity, which eliminates the need for third-party participation during financial transactions.
Altcoins are any cryptocurrency apart from Bitcoin, but some also regard Ethereum as a non-altcoin because it is from these two cryptocurrencies that forking happens. If this is true, then Litecoin is the first altcoin, forked from the Bitcoin protocol and, therefore, an “improved” version of it.
Stablecoins are cryptocurrencies designed to have a stable price, with their value backed by a reserve of the asset it represents. To achieve this, the value of any one stablecoin is pegged to a commodity or financial instrument, such as the US Dollar (USD), with its supply regulated by an algorithm or demand. The main goal of stablecoins is to provide an on/off-ramp for investors willing to trade and invest in cryptocurrencies. Stablecoins also allow investors to store value since cryptocurrencies, in general, are subject to volatility.
Bitcoin dominance is the ratio of Bitcoin's market capitalization to the total market capitalization of all cryptocurrencies combined. It provides a clear picture of Bitcoin’s interest among investors. A high BTC dominance typically happens before and during a bull run, in which investors resort to investing in relatively stable and high market capitalization cryptocurrency like Bitcoin. A drop in BTC dominance usually means that investors are moving their capital and/or profits to altcoins in a quest for higher returns, which usually triggers an explosion of altcoin rallies.
추천 기사


