
Bitcoin Weekly Forecast: BTC demand and liquidity conditions remain weak
- Bitcoin price has been consolidating between $94,000 and $100,000 since early February.
- US Bitcoin spot ETF data recorded a total net outflow of $489.60 million until Thursday.
- CryptoQuant’s report suggests that if demand growth and liquidity conditions do not improve, Bitcoin price could decline to $86,000.
Bitcoin (BTC) price has been consolidating between $94,000 and $100,000 since early February, hovering around $98,000 at the time of writing on Friday. Despite this consolidation, US Bitcoin spot Exchange Traded Funds (ETFs) data recorded a total net outflow of $489.60 million until Thursday, hinting signs of weakness among institutional investors. Moreover, a CryptoQuant’s report suggests that if demand growth and liquidity conditions do not improve, the price of Bitcoin could decline to $86,000.
Bitcoin institutional demand continues to weaken
Bitcoin’s price consolidates between $94,000 and $100,000 while its institutional demand weakens this week. According to Coinglass, Bitcoin spot ETF data recorded outflows totaling $489.6 million until Thursday, after $580.2 million the previous week. If the magnitude of the outflow continues and intensifies, the Bitcoin price could see further corrections.
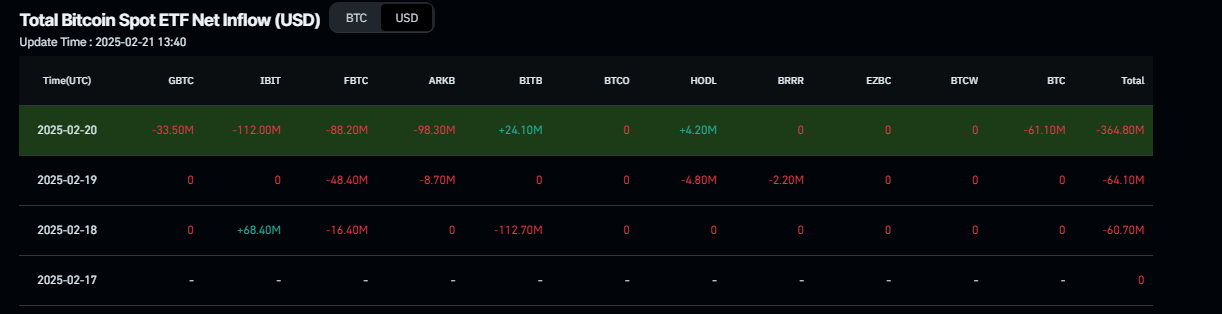
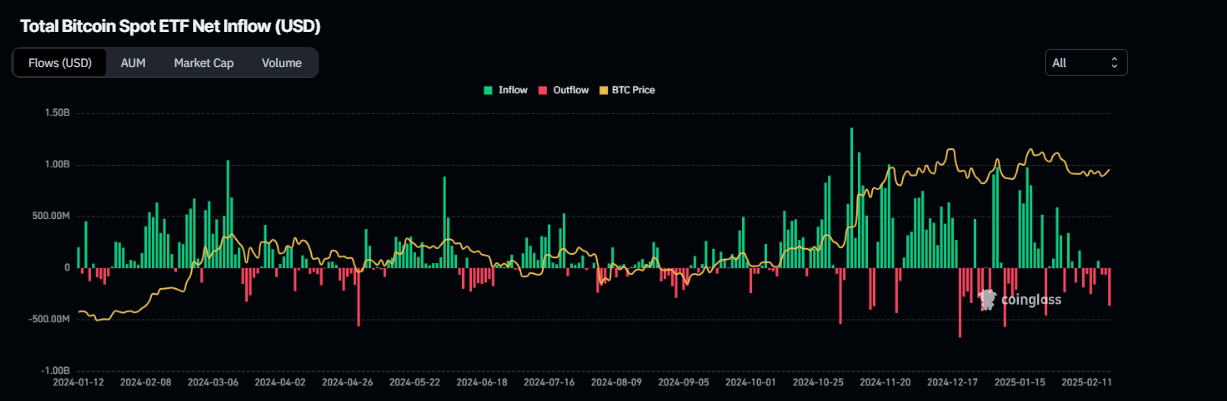
Total Bitcoin Spot ETF Net Inflow chart. Source: Coinglass
Additionally, the CryptoQuant report this week explains that the demand for Bitcoin remains low. The chart below shows that Bitcoin’s apparent demand growth has declined after accelerating in November-December 2024, spurred by the US Presidential election results. It has declined to 70K this week from 279K on December 4.
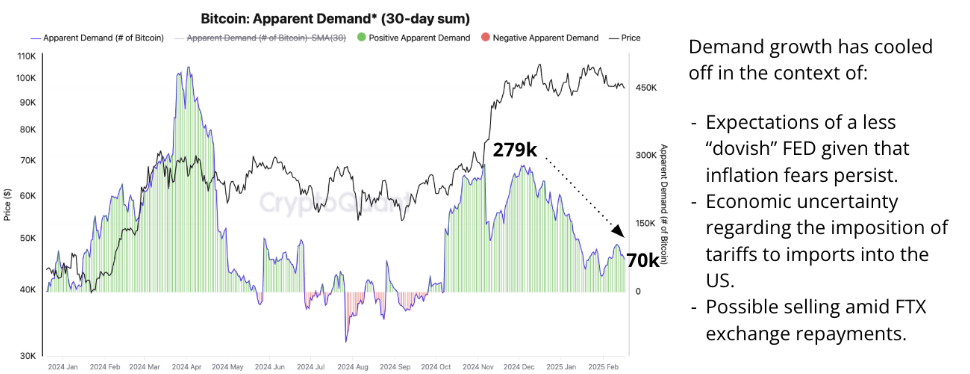
Bitcoin Apparent Demand (30-day sum) chart. Source: CryptoQuant
FTX repayments dip in Bitcoin price
Bitcoin price dipped on Tuesday, reaching a low of $93,388 but recovering to close above $95,600. This price knee-jerk move was mostly fueled by the news that defunct crypto exchange FTX has begun repaying funds to customers with account balances of $50,000 or less. FTX also announced that repayments to customers over $50,000 will start on May 30.
According to Arkham data, the bankrupt exchange started repaying its creditors on Tuesday. Users with FTX claims of under $50,000 have started receiving funds through distribution providers Kraken and Bitgo. This wave of creditors represents approximately $1.2 billion in value. However, the payouts are expected to total up to $16.5 billion.
FTX USERS RECEIVING FUNDS
— Arkham (@arkham) February 18, 2025
Users with FTX claims of under $50,000 have started to receive funds today through distribution providers Kraken and Bitgo.
This wave of creditors represents approximately $1.2B in value. pic.twitter.com/SFGdsNOrBS
Bitcoin volatility hits history low
This week’s K33 Research ‘Ahead of the Curve’ report highlights volumes, yields, options premiums, and ETF flows have moved to areas not seen since before the US Presidential election in November, with volatility at multi-month lows.
-638757324832951813.png)
BTC/USD volatility chart. Source: K33 Research
The report further explains that as of February 13, 37% of the top 100 US companies exhibited greater 30-day volatility than BTC, a level not seen since October 2023. As evidenced in the graph below, such volatility regimes rarely last long, and traders should be ready for a sudden regime change.
An overall risk-averse sentiment suggests traders are prepared for downside volatility, while moderate leverage levels currently point toward less overhanging risks of liquidation cascades.
-638757325193069376.png)
(Left) 30-day volatility: BTC vs top 100 US companies chart. (Right) % of top US companies with 30-day volatility higher than the BTC chart. Source: K33 Research report
Moreover, the CryptoQuant report explains that Bitcoin network activity continues to decline, reaching the lowest level in a year and entering a negative trend. CryptoQuant’s Bitcoin Network Activity Index indicates that activity has decreased by 17% since the November record high. The index is now at 3,658, the lowest level since February 2024. Moreover, the index has fallen significantly below its 365-day moving average, which had not occurred since July 2021 after China banned Bitcoin mining. This indicates network activity has entered a negative (pink area) trend, as shown in the graph below.
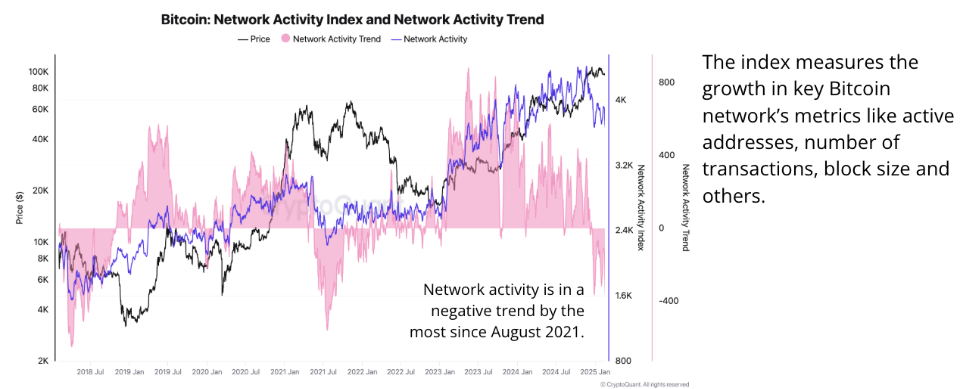
Bitcoin Network Activity chart. Source: CryptoQuant
The report concluded that if demand growth and liquidity conditions do not improve, the price of Bitcoin could decline to $86,000. This level represents the Trader’s On-chain Realized Price minimum band (dotted light blue line), which supports price corrections in a bull market. This level acted as support in July-September 2024 and October 2023.
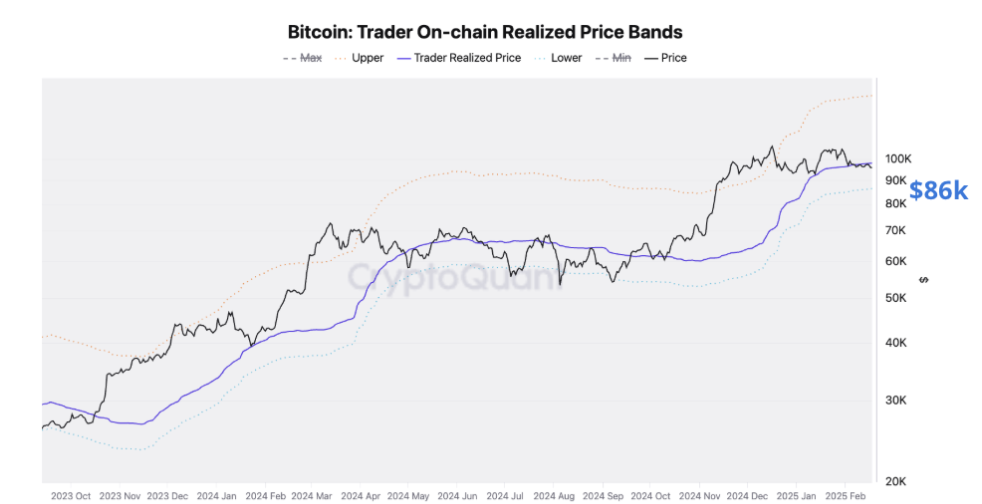
Bitcoin Trader on-chain realized price bands chart. Source: CryptoQuant
Is Bitcoin consolidation ending soon?
Bitcoin price has been consolidating between $94,000 and $100,000 for more than two weeks. On Tuesday, BTC declined and found support around the lower boundary of the consolidating range and rose 2.75% until Thursday. At the time of writing on Friday, it hovers around $98,000.
If BTC recovers and breaks above the upper boundary of the consolidating range of $100,000, it would extend the recovery to retest its January 30 high of $106,457.
The Moving Average Convergence Divergence (MACD) indicator showed a bullish crossover on the daily chart on Thursday, giving a buy signal and indicating an upward trend ahead.
However, the Relative Strength Index (RSI) on the daily chart hovers around its neural level of 50, indicating a lack of momentum and indecisiveness among investors. For the bullish momentum to start, the RSI must accelerate above its neutral level of 50.
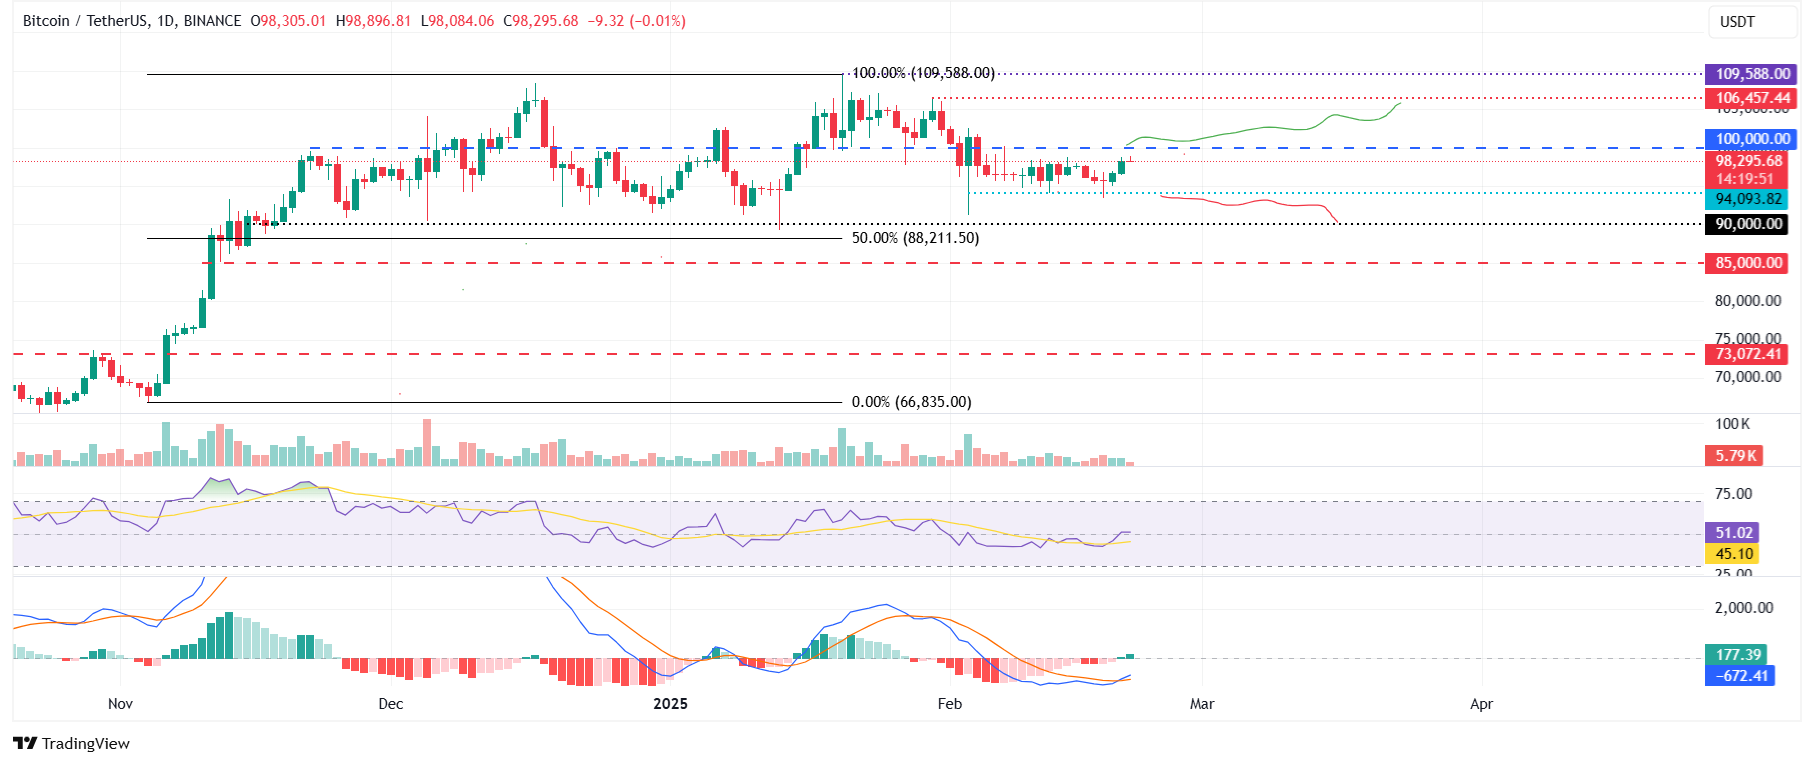
BTC/USDT daily chart
Conversely, if BTC breaks and closes below the lower boundary of the consolidating range of $94,000, it could extend the decline to test its psychologically important level of $90,000.
Bitcoin, altcoins, stablecoins FAQs
Bitcoin is the largest cryptocurrency by market capitalization, a virtual currency designed to serve as money. This form of payment cannot be controlled by any one person, group, or entity, which eliminates the need for third-party participation during financial transactions.
Altcoins are any cryptocurrency apart from Bitcoin, but some also regard Ethereum as a non-altcoin because it is from these two cryptocurrencies that forking happens. If this is true, then Litecoin is the first altcoin, forked from the Bitcoin protocol and, therefore, an “improved” version of it.
Stablecoins are cryptocurrencies designed to have a stable price, with their value backed by a reserve of the asset it represents. To achieve this, the value of any one stablecoin is pegged to a commodity or financial instrument, such as the US Dollar (USD), with its supply regulated by an algorithm or demand. The main goal of stablecoins is to provide an on/off-ramp for investors willing to trade and invest in cryptocurrencies. Stablecoins also allow investors to store value since cryptocurrencies, in general, are subject to volatility.
Bitcoin dominance is the ratio of Bitcoin's market capitalization to the total market capitalization of all cryptocurrencies combined. It provides a clear picture of Bitcoin’s interest among investors. A high BTC dominance typically happens before and during a bull run, in which investors resort to investing in relatively stable and high market capitalization cryptocurrency like Bitcoin. A drop in BTC dominance usually means that investors are moving their capital and/or profits to altcoins in a quest for higher returns, which usually triggers an explosion of altcoin rallies.
추천 기사


