
Solana Price Forecast: SOL short traders set to lose $220M if this happens
- Solana price has dipped below the $230 mark on Friday, as bullish tailwinds from LTC ETF advances tapered off.
- In the derivatives market SOL traders have mounted $217 million short positions around the $265 price levels.
- Dominant bear leverage amid a price rebound phase suggests potential short-squeeze if the positive market sentiment lingers.
Solana price crossed $230 on Friday, with large number of Short traders caught unawares by the earlier-than-expected ETF approval rumors, is SOL price
Solana price tops $230 on LTC ETF chatter
Solana (SOL) surged past the $230 mark on Friday, driven by renewed investor interest following speculative chatter around an early approval for a Litecoin ETF.
The digital asset, which had been consolidating near the $220 range earlier in the week, witnessed a sharp uptick in momentum as broader cryptocurrency markets reacted positively to the ETF discussions.
Solana’s price action mirrored that of other major tokens, with Bitcoin (BTC) hovering around $43,000 and Ethereum (ETH) climbing above $2,400.
Litecoin (LTC), the primary catalyst for the latest market enthusiasm, saw a near 15% gain breaking above $130 spike as Bloomberg analysts hinted at positive ETF-related developments.
 Solana Price Action | SOLUSDT
Meanwhile, other Proof-of-Work assets such as Bitcoin Cash (BCH) and Monero (XMR) also experienced notable gains, suggesting a market-wide optimism spreading beyond Solana.
Despite a temporary pullback following its peak at $235, SOL’s trading volume remains elevated, indicating strong investor engagement.
With market sentiment lending positive, Solana could be primed for another leg up towards the $250-$265 range in the coming days.
However, resistance at the $240 mark remains a key level to watch for traders looking for confirmation of a sustained breakout.
Bears Caught Unaware with $220M Leverage
With Solana price recovery in full swing, a significant number of short traders find themselves in a precarious position.
Over $217 million in short positions have been built around the $265 level in the derivatives market, leaving them vulnerable to a potential short squeeze.
The rapid uptick in SOL’s price, driven in part by speculative ETF optimism, appears to have caught bearish traders off guard, amplifying the likelihood of a liquidation cascade if bullish momentum holds.
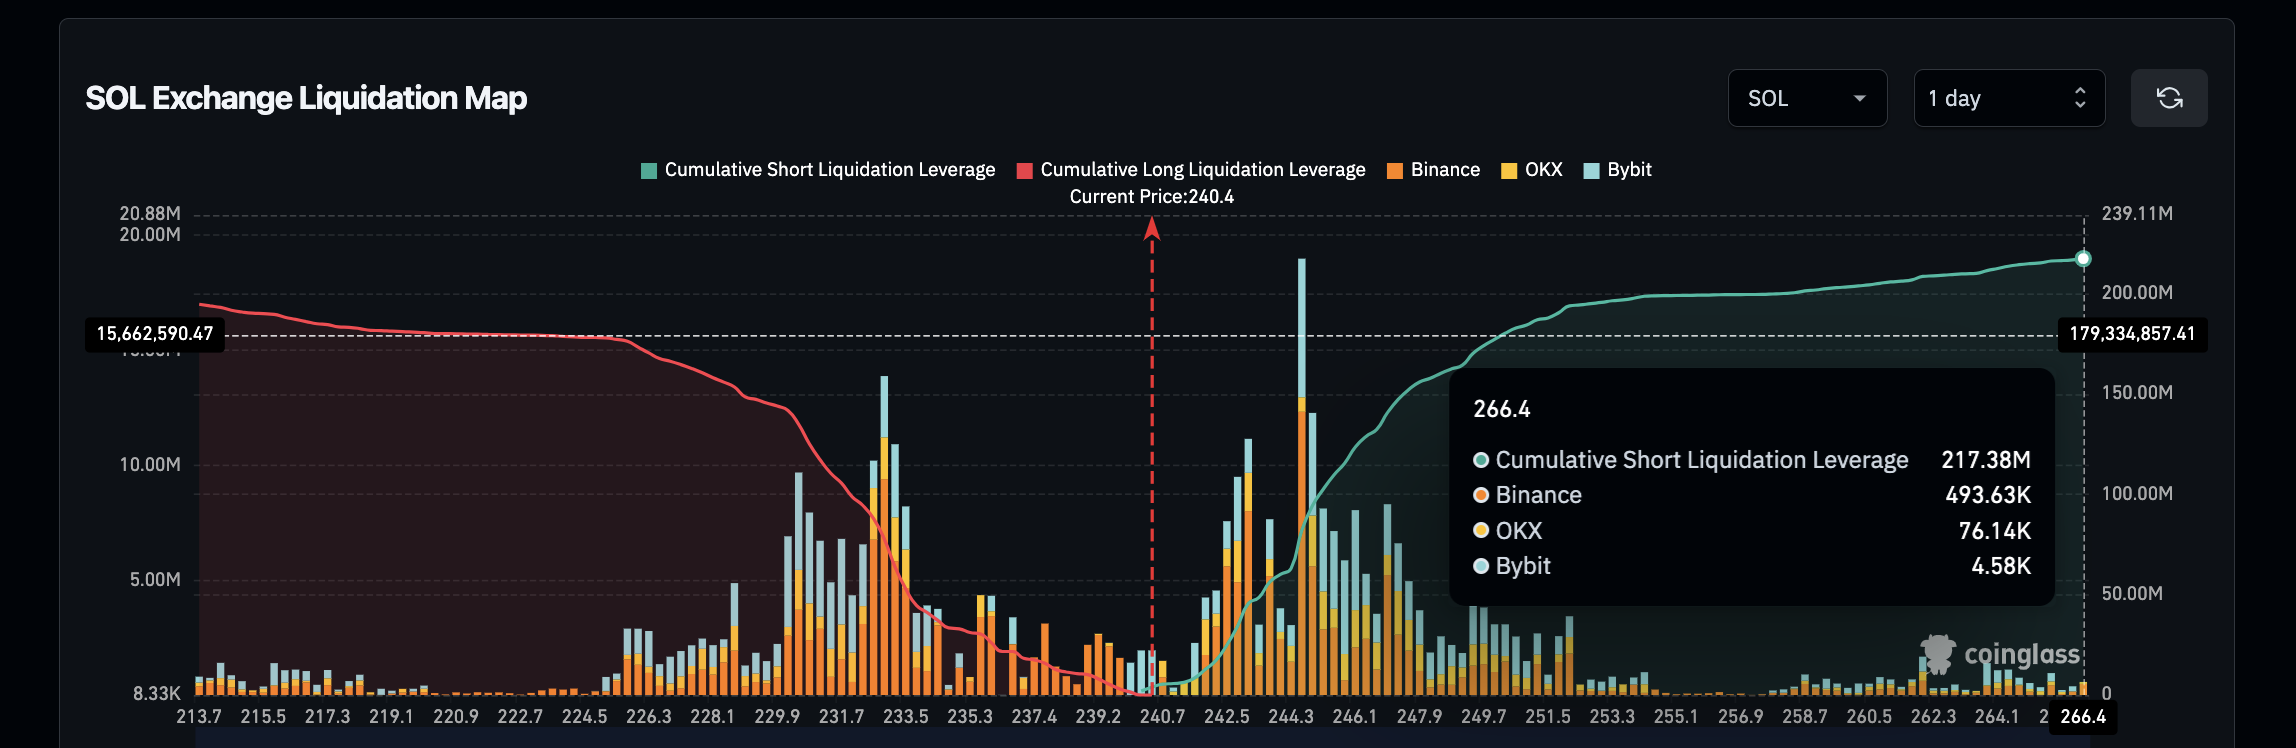
Solana (SOL) Liquidation Map | Jan 31, 2025
As seen above, amid the 7% gains on the day, SHORT traders were holding over $217 million active short leverage contracts at press time on Friday, outpacing long positions, listed for $193 million.
Historically, short positions exceeded longs during the recovery phase as observed in the SOL derivatives markets this week.
This rare market dynamics often leads to a short squeeze—a scenario where short sellers are forced to buy back their positions as prices move against them, further accelerating the upward movement.
If Solana maintains its current trajectory and pushes towards the $250-$265 resistance zone, forced liquidations could fuel an aggressive rally, putting additional pressure on short sellers and strengthening the bullish outlook.
Solana Price Forecast: All eyes on $250 resistance
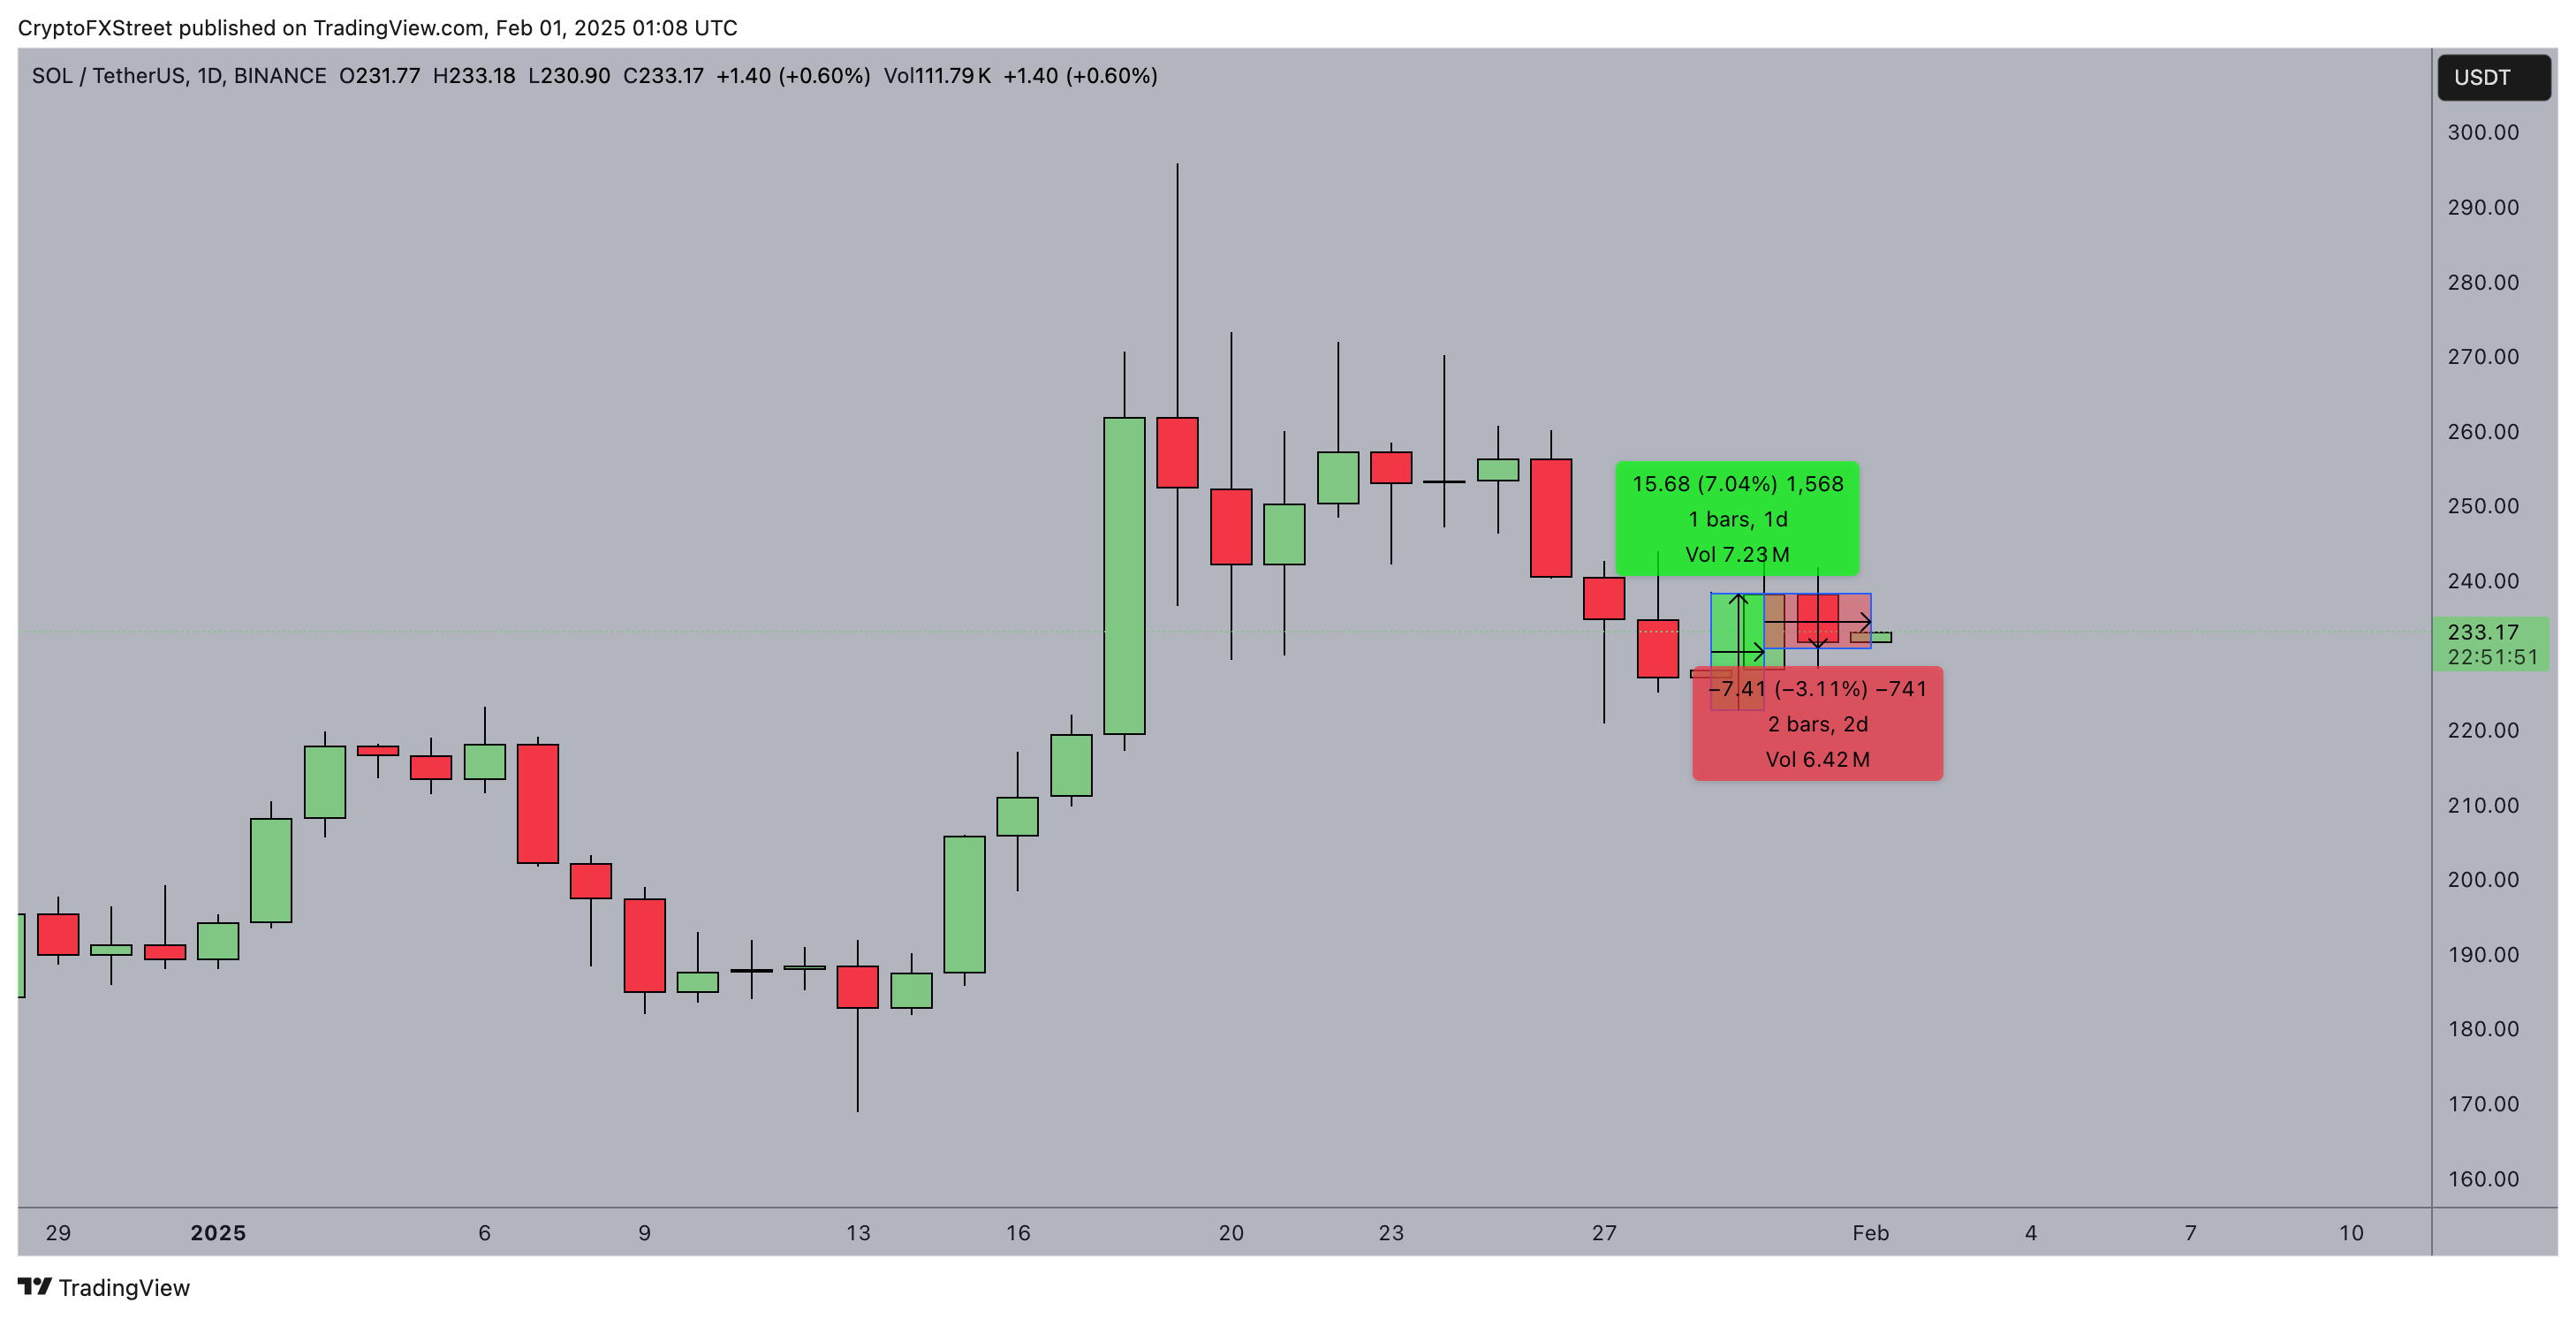
Solana price action on the daily chart suggests a battle for dominance between bulls and bears as it hovers around $232.72.
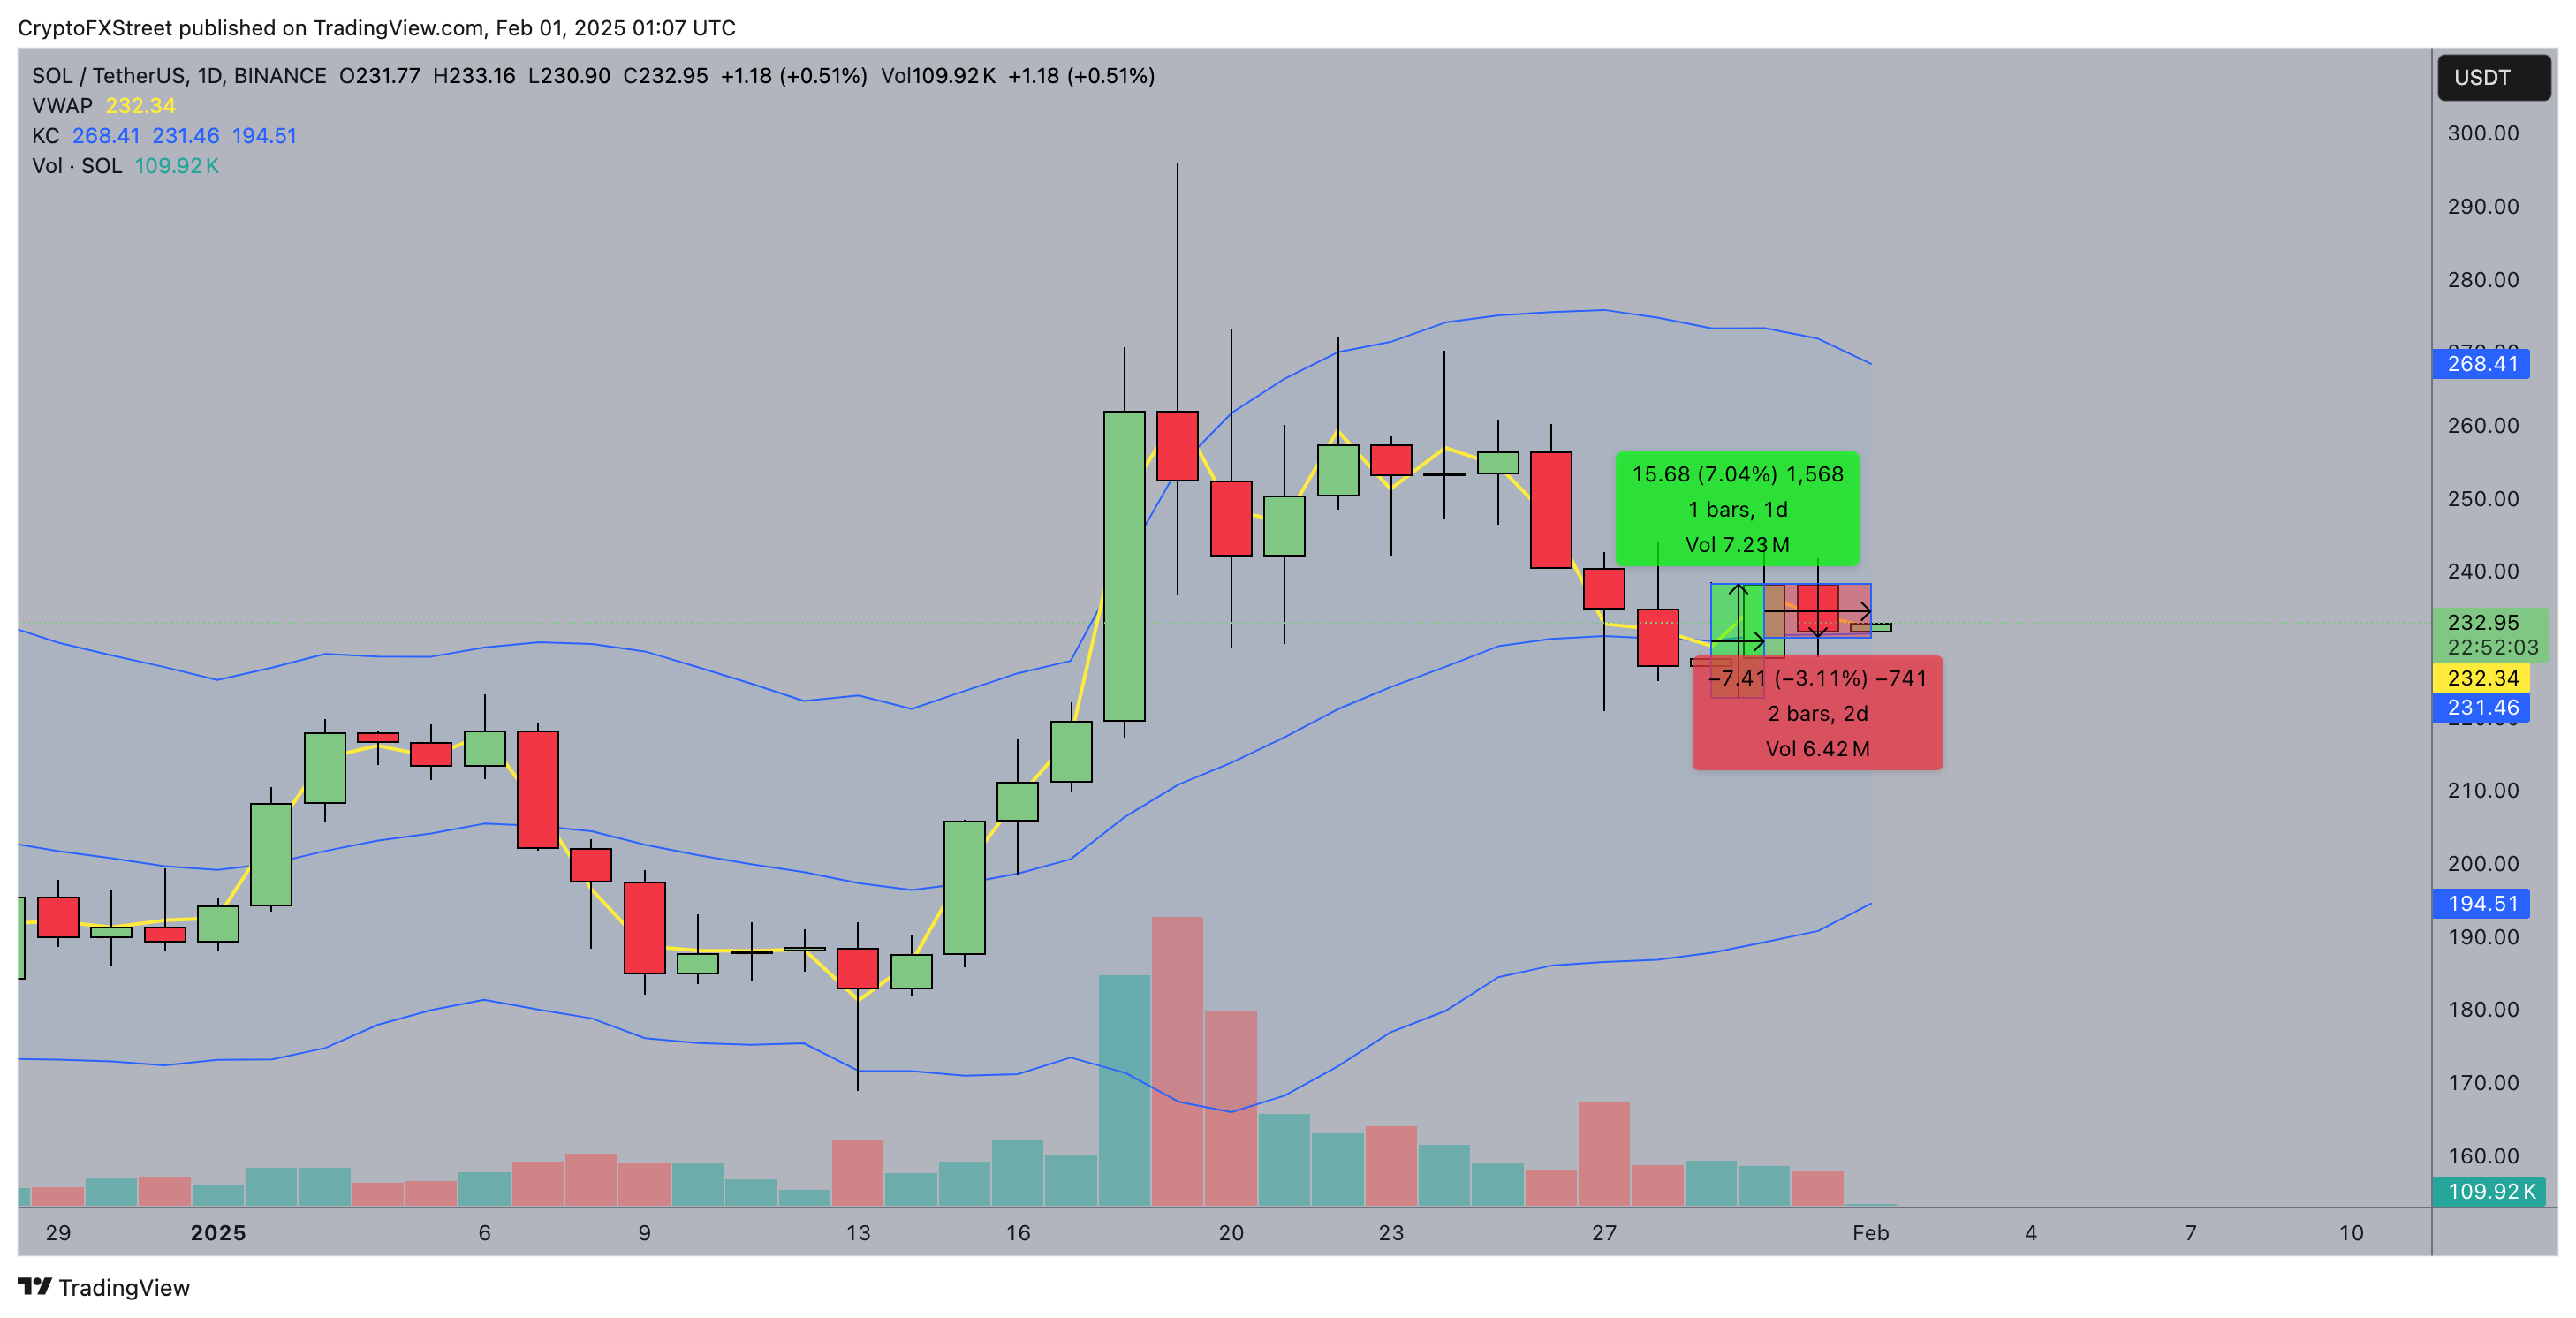
The asset is trading slightly above VWAP at $232.26, signaling a neutral-to-bullish stance in the short term.
The Keltner Channel mid-line at $231.44 is providing immediate support, while the lower band at $194.49 remains a distant safety net.
The volume at 104.56K indicates moderate participation, though the previous sessions saw notable sell-side pressure.
Solana Price Forecast
A bullish case is reinforced by the 7.04% daily surge, as highlighted by the green-marked trade setup, suggesting a short-term relief rally.
If buyers sustain momentum, a breakout past $250 could trigger a short squeeze, bringing the upper Keltner resistance of $268.39 into play.
The broader macro environment, including US Fed rate pause discussions and Litecoin ETF speculation, could further fuel this push.
Conversely, the red-marked 3.11% drop over two days hints at persistent bearish resistance.
Failure to hold above the mid-Keltner level may expose SOL to a deeper retracement toward $194.49, invalidating the bullish outlook.
추천 기사


