
Bitcoin Price Forecast: BTC fails to sustain the $109K mark after Trump’s inauguration
- Bitcoin price holds above the $100K mark on Tuesday after reaching a new all-time high of $109,588 the previous day.
- Santiment’s data shows that BTC prices quickly corrected, as social media showed major greed and FOMO after Trump’s inauguration.
- Bitfinex Analysts told FXStreet that President-elect Trumpʼs inauguration ceremony could potentially be a sell-the-news event.
Bitcoin’s (BTC) price steadies above the $102,000 mark on Tuesday after reaching a new all-time high of $109,588 the previous day. Santiment’s data shows that BTC prices quickly corrected, as social media showed major greed and Fear Of Missing Out (FOMO) among the traders in Bitcoin after President Donald Trump’s inauguration. Moreover, Bitfinex Analysts told FXStreet that Trumpʼs inauguration ceremony could potentially be a sell-the-news event.
Bitcoin wobbles as Trump’s inauguration speech ignores BTC
Bitcoin price reached a new all-time high (ATH) of $109,588 on Monday, early hours before Donald Trump’s inauguration. However, after the event, BTC quickly slipped 6.68% from its ATH, closing at $102,260. This price wobble was fueled by Trump’s inauguration speech, which ignored Bitcoin. According to Coinglass data, BTC liquidations totaled $253.45 million in the past 24 hours, and the largest single liquidation order was placed on Binance – BTCUSDT, valued at $12.54 million.
Santiment’s data shows that social media showed major greed and FOMO among the traders in Bitcoin. This chart below shows mentions on X, Reddit, Telegram, 4Chan, and Farcaster. Historically, prices move in the opposite direction of the crowd’s expectation, particularly in the short term.
In BTC’s case, the mentions of higher prices by the crowd on Monday signaled selling signals. A similar move occurred in mid-December when the crowd's mention of higher prices led to a short-term fall in Bitcoin prices.
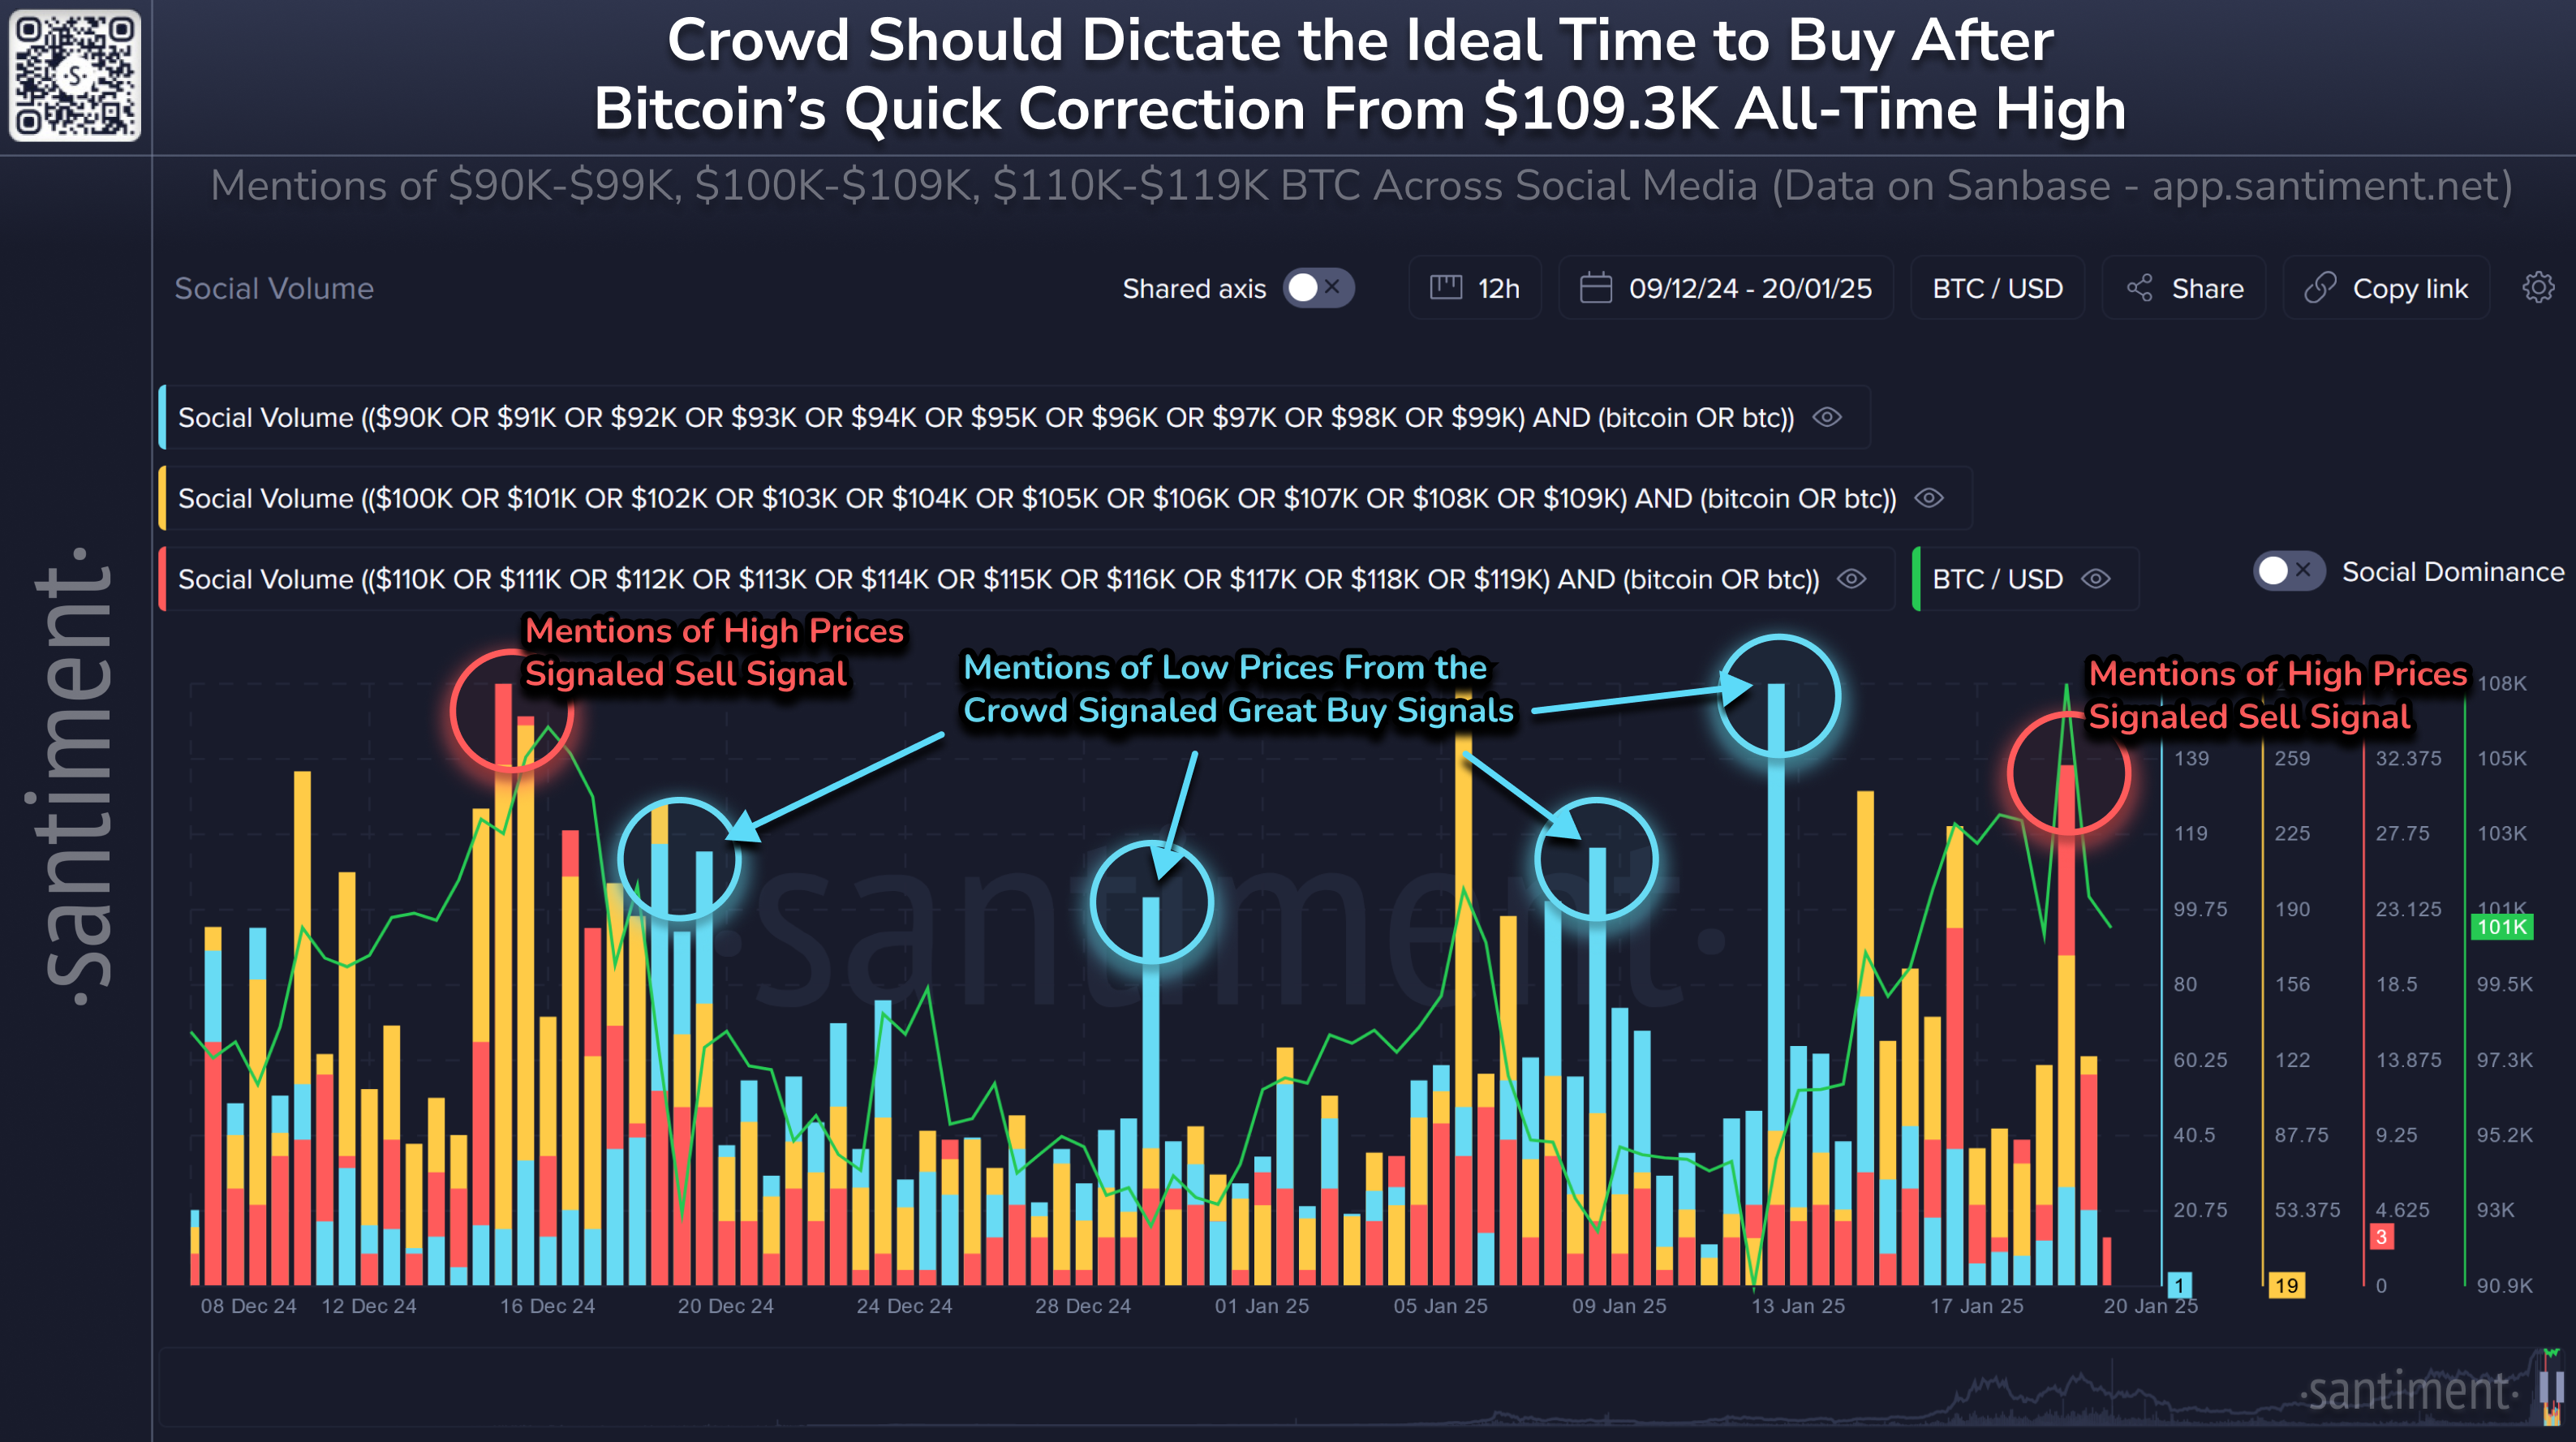
Bitcoin Social Volume chart. Source: Santiment
The Bitfinex alpha report on Monday highlights that Bitcoin’s recovery last week was primarily fuelled by aggressive spot buying. The graph below shows a sharp rise in the Spot Cumulative Volume Delta (CVD) indicator. The CVD is an essential market metric for analyzing buying and selling pressure in spot markets. It tracks the net difference between the market buy and sell orders over a period.
When CVD rises aggressively, it indicates that buying pressure is dominant in the spot market. This suggests buyers actively lift ask prices, signaling strong demand and potential upward momentum for the asset.
The report further explains that a significant portion of the buy volume has originated from US-based exchanges, with the buying pattern mirroring that of previous MicroStrategy and Exchange Traded Funds (ETF) buys, reinforcing the view that institutional demand remains strong.
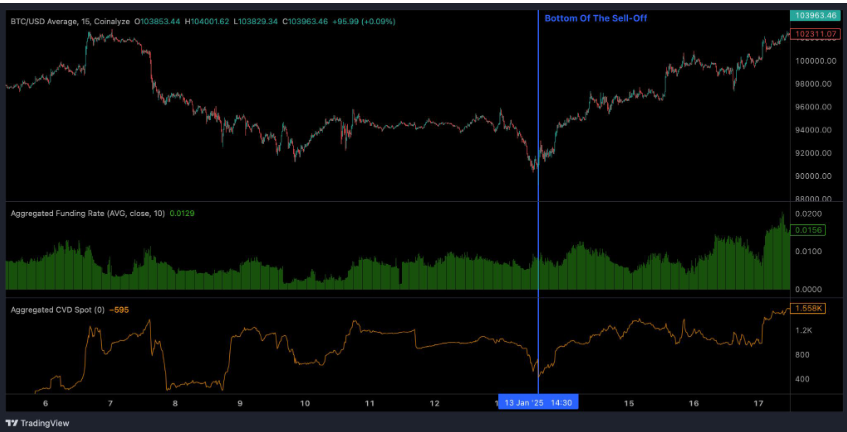
Bitcoin Spot Cumulative Volume Delta chart. Source: Bitfinex
In an exclusive interview, Bitfinex analysts told FXStreet, “We believe that President-elect Trumpʼs inauguration ceremony could potentially be a sell-the-news event.”
The analyst continued, “However, the spot buying pressure seen last week might require time for bids to replenish, potentially triggering a brief pullback before further upward momentum resumes.”
Bitcoin Price Forecast: BTC fails to hold the $109K level
Bitcoin price reached a new all-time high (ATH) of $109,588 on Monday but quickly slipped 6.68% from that level, closing at $102,260. At the time of writing on Tuesday, it hovers above $102,000.
If BTC continues its upward momentum and breaks above its all-time-high, it could extend the rally above the $125K mark, calculated by the 141.40% Fibonacci extension level (drawn from the November 4 low of $66,835 to Monday’s ATH of $109,588) at $127,287.
The Relative Strength Index (RSI) indicator on the daily chart reads 58, above its neutral level of 50, indicating a rise in bullish momentum. Additionally, the Moving Average Convergence Divergence (MACD) indicator flipped a bullish crossover on January 15, giving a buy signal and suggesting a continuation of an uptrend.
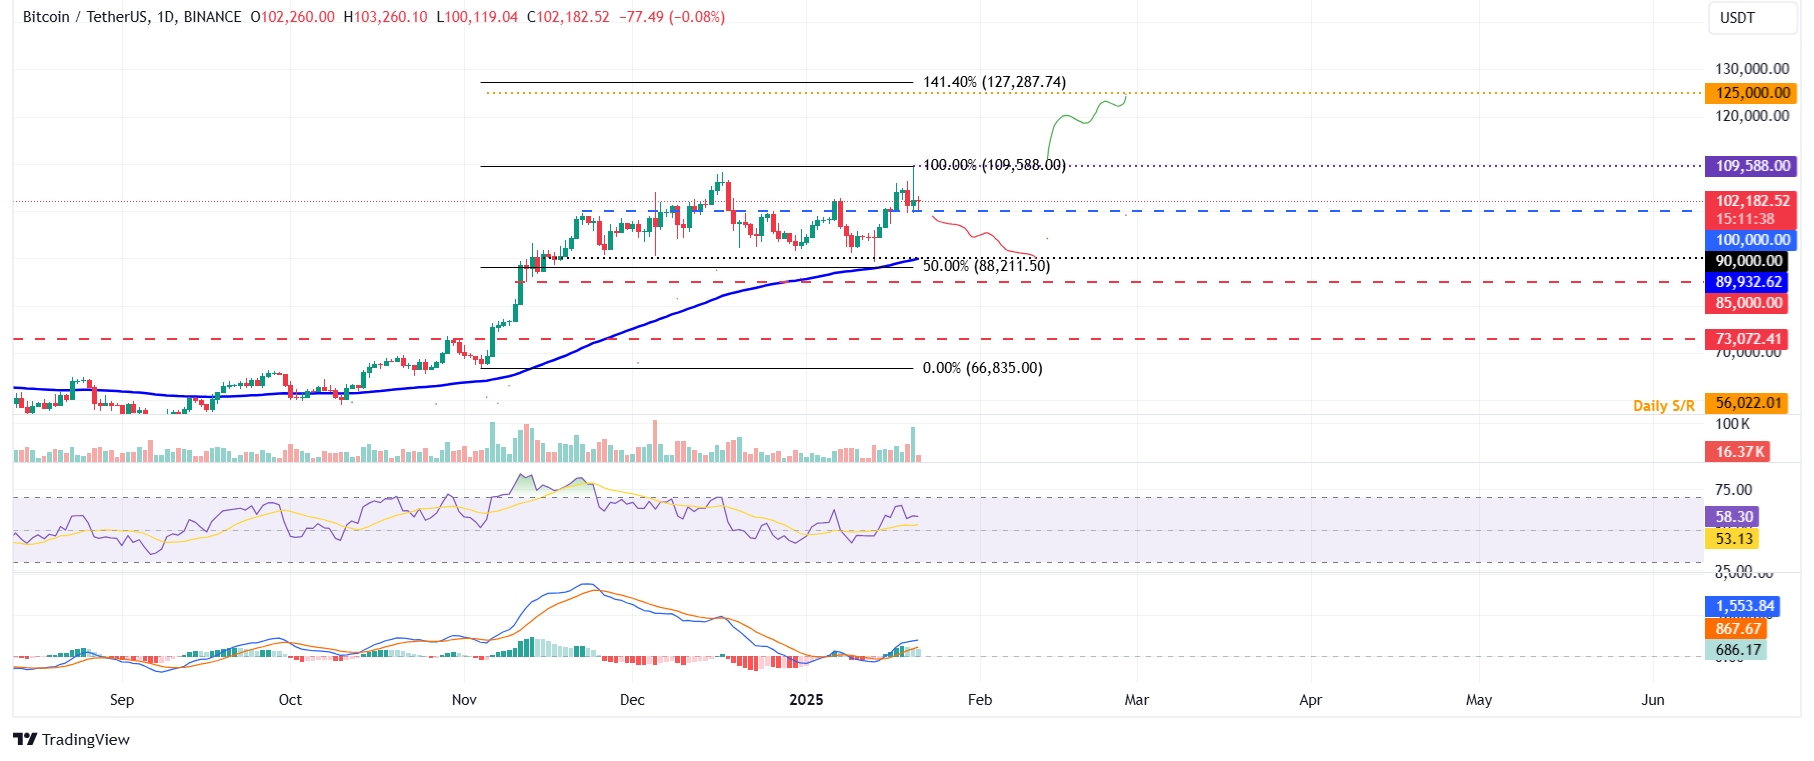
BTC/USDT daily chart
However, if BTC faces a pullback and closes below $100,000, it could extend the decline to retest its next support level at $90,000.
Bitcoin, altcoins, stablecoins FAQs
Bitcoin is the largest cryptocurrency by market capitalization, a virtual currency designed to serve as money. This form of payment cannot be controlled by any one person, group, or entity, which eliminates the need for third-party participation during financial transactions.
Altcoins are any cryptocurrency apart from Bitcoin, but some also regard Ethereum as a non-altcoin because it is from these two cryptocurrencies that forking happens. If this is true, then Litecoin is the first altcoin, forked from the Bitcoin protocol and, therefore, an “improved” version of it.
Stablecoins are cryptocurrencies designed to have a stable price, with their value backed by a reserve of the asset it represents. To achieve this, the value of any one stablecoin is pegged to a commodity or financial instrument, such as the US Dollar (USD), with its supply regulated by an algorithm or demand. The main goal of stablecoins is to provide an on/off-ramp for investors willing to trade and invest in cryptocurrencies. Stablecoins also allow investors to store value since cryptocurrencies, in general, are subject to volatility.
Bitcoin dominance is the ratio of Bitcoin's market capitalization to the total market capitalization of all cryptocurrencies combined. It provides a clear picture of Bitcoin’s interest among investors. A high BTC dominance typically happens before and during a bull run, in which investors resort to investing in relatively stable and high market capitalization cryptocurrency like Bitcoin. A drop in BTC dominance usually means that investors are moving their capital and/or profits to altcoins in a quest for higher returns, which usually triggers an explosion of altcoin rallies.
추천 기사


