Bitcoin Weekly Forecast: BTC rallies above $102,000 ahead of Trump’s inauguration
- Bitcoin price continues to trade in the green on Friday after rallying more than 7% this week.
- US macroeconomics data released this week supported risky assets like BTC.
- K33 report suggests that selling BTC at the inauguration is becoming less compelling.
Bitcoin’s (BTC) price continues to trade in the green, trading above $102,000 at the time of writing on Friday after rallying more than 7% this week. Recent US macroeconomic data released this week supported the rise of risky assets like BTC. A K33 report suggests that selling BTC at the US President-elect Donald Trump’s inauguration on Monday is becoming less compelling.
Bitcoin trades above the $100K mark ahead of Trump’s inauguration
Bitcoin’s price has risen more than 7% so far this week, trading above $102,000 at the time of writing on Friday. According to a K33 report this week, “Selling BTC at the inauguration is gradually becoming less compelling every day as we inch closer to the inauguration.” The market jumped the gun with Trump enthusiasm in November until mid-December, but conservatism and caution have since prevailed.
The report further explains that the S&P 500 index’s early post-election reaction in 2024 closely mirrored that of 2016. However, following the December 18 Federal Reserve (Fed) meeting, the index’s pattern diverged from 2016. In 2016, the S&P 500 stabilized at mid-December highs, saw low volatility until the inauguration and faced a year-long uptrend as Trump entered the Oval Office.
“During Trump’s first term as president, he frequently referenced stock market indices to emphasize economic growth associated with policies, tax cuts, deregulation, and trade deals, a factor we expect to re-emerge throughout his second term,” says the report.
The report concluded that earlier this week, “the S&P 500 closed its post-election gap, and BTC reached 2-month lows. While our monthly outlook favored selling the inauguration, we’d like to rephrase this strategy as selling BTC at the inauguration is considerably less appealing unless the coming six days offer a substantial resurfacing of momentum. De-risking would be path-dependent on next week’s price action and short-lived as we hold bullish long-term expectations for Trump’s impact on BTC.”
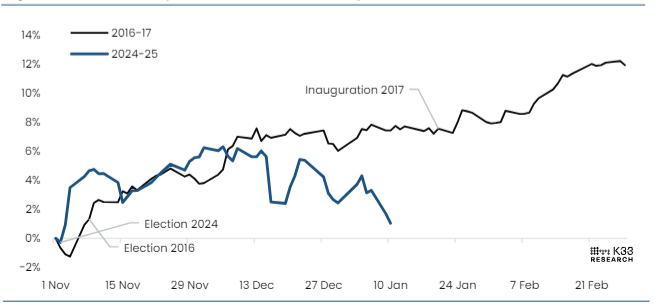
S&P 500, Trump election performance comparisons (2016 vs 2024) chart. Source: K33 Research
The upcoming Donald Trump’s inauguration on Monday and expectations that US Securities and Exchange Commission (SEC) policies surrounding crypto will change once Trump takes office are taking over the sentiment. Additionally, the ceasefire between Israel and Hamas further supports the bullish sentiment at the time of this writing.
Today, after many months of intensive diplomacy by the United States, along with Egypt and Qatar, Israel and Hamas have reached a ceasefire and hostage deal.
— President Biden (@POTUS) January 15, 2025
My diplomacy never ceased in their efforts to get this done – I will speak more about this soon. pic.twitter.com/iETWhGXEGA
US macroeconomics data supports Bitcoin
Bitcoin’s price was supported by the US macroeconomic data releases this week. On Tuesday, the US Bureau of Labor Statistics reported that the Producer Price Index (PPI), which measures wholesale inflation, rose 0.2% in December, below the 0.3% expected and the 0.4% reading in November. The core gauge, which excludes volatile prices of Energy and Food, remained flat during the reported month. This comes after the upbeat US monthly jobs report last Friday and makes it difficult for investors to project the Federal Reserve’s next moves on interest rates, keeping the US Dollar (USD) bulls on the defensive. Meanwhile, Bitcoin recovered 2.14% on that day.
Following the PPI data, the US Consumer Price Index (CPI) for December on Wednesday further supported Bitcoin price. On a yearly basis, the data showed that headline CPI aligned with expectations, increasing 2.9% in December compared to 2.7% in the previous month. At the same time, core CPI inflation accelerated slower than expected and slower than the prior reading for November. This was perceived as disinflationary and favored risky assets like Bitcoin, which closed above the $100K mark.
Lastly, on Thursday, the US Retail Sales data for December came in at 0.4% month-on-month, softer than the expected 0.6% increase and 0.8% (revised from 0.7%) in the previous month. However, the Retail Sales Control Group, known as the “core of the core,” rose by 0.7% compared to 0.4% in November. The aftermath of mixed Retail Sales data led to a mild 0.5% decline in Bitcoin price on Thursday. However, at the time of writing on Friday, BTC continues edging higher and trades above $102,000.
Institutional demand shows a mild sign of recovery
Institutional demand recovered slightly this week but remained weak, as seen in early December. According to Coinglass, Bitcoin spot Exchange Traded Fund (ETF) data recorded a total net inflow of $887.3 million until Thursday, after a $312.8 million inflow last week. For Bitcoin’s price to recover and rally, the magnitude of the ETF inflow must intensify.
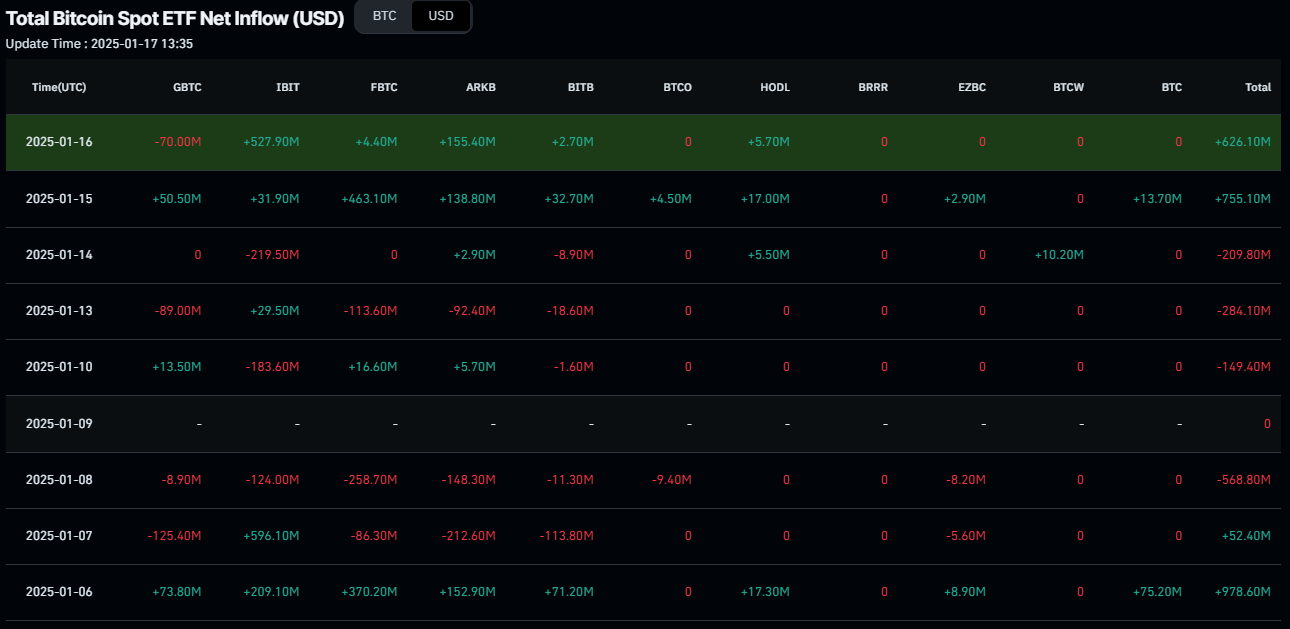
Total Bitcoin spot ETF net inflow chart. Source: Coinglass
Bitcoin key on-chain metrics to watch for
According to Santiment, data highlights the key on-chain metrics that traders should watch for in the upcoming days.
Firstly, the accumulation of wallets holding at least 10+ BTC appears to be resuming. This is a welcome sight after sudden stagnation in the second half of December and the first week of January. Prices often follow this bright green line in the long term, which helps justify that crypto’s latest rebound this week is genuine. However, traders should watch the declining Tether (red line) and USD Coin (blue line) by key stakeholders, which is likely to pick up again.
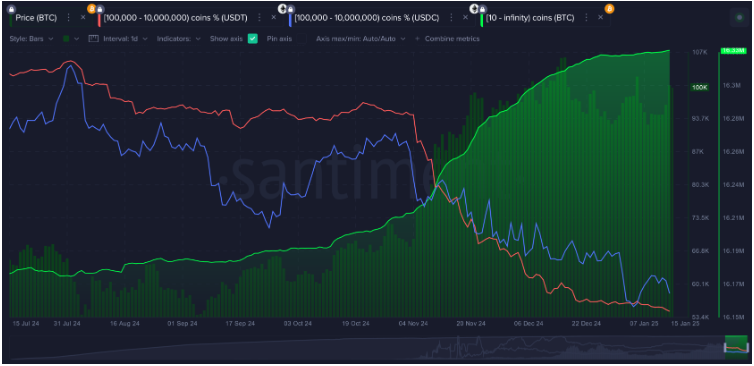
Bitcoin 10+ holders wallet chart. Source: Santiment
Along the same topic, the total amount of non-empty wallets has been shrinking over the past six weeks, with many small retail traders taking profits and hoping to get lucky by timing the top. The total number of wallets is small, typically getting their timing wrong. Over history, Bitcoin has often seen the biggest rallies start when this number is declining, especially when whales are scooping up the coins being shed by Fear, Uncertainty, and Doubt (FUD) retailers.
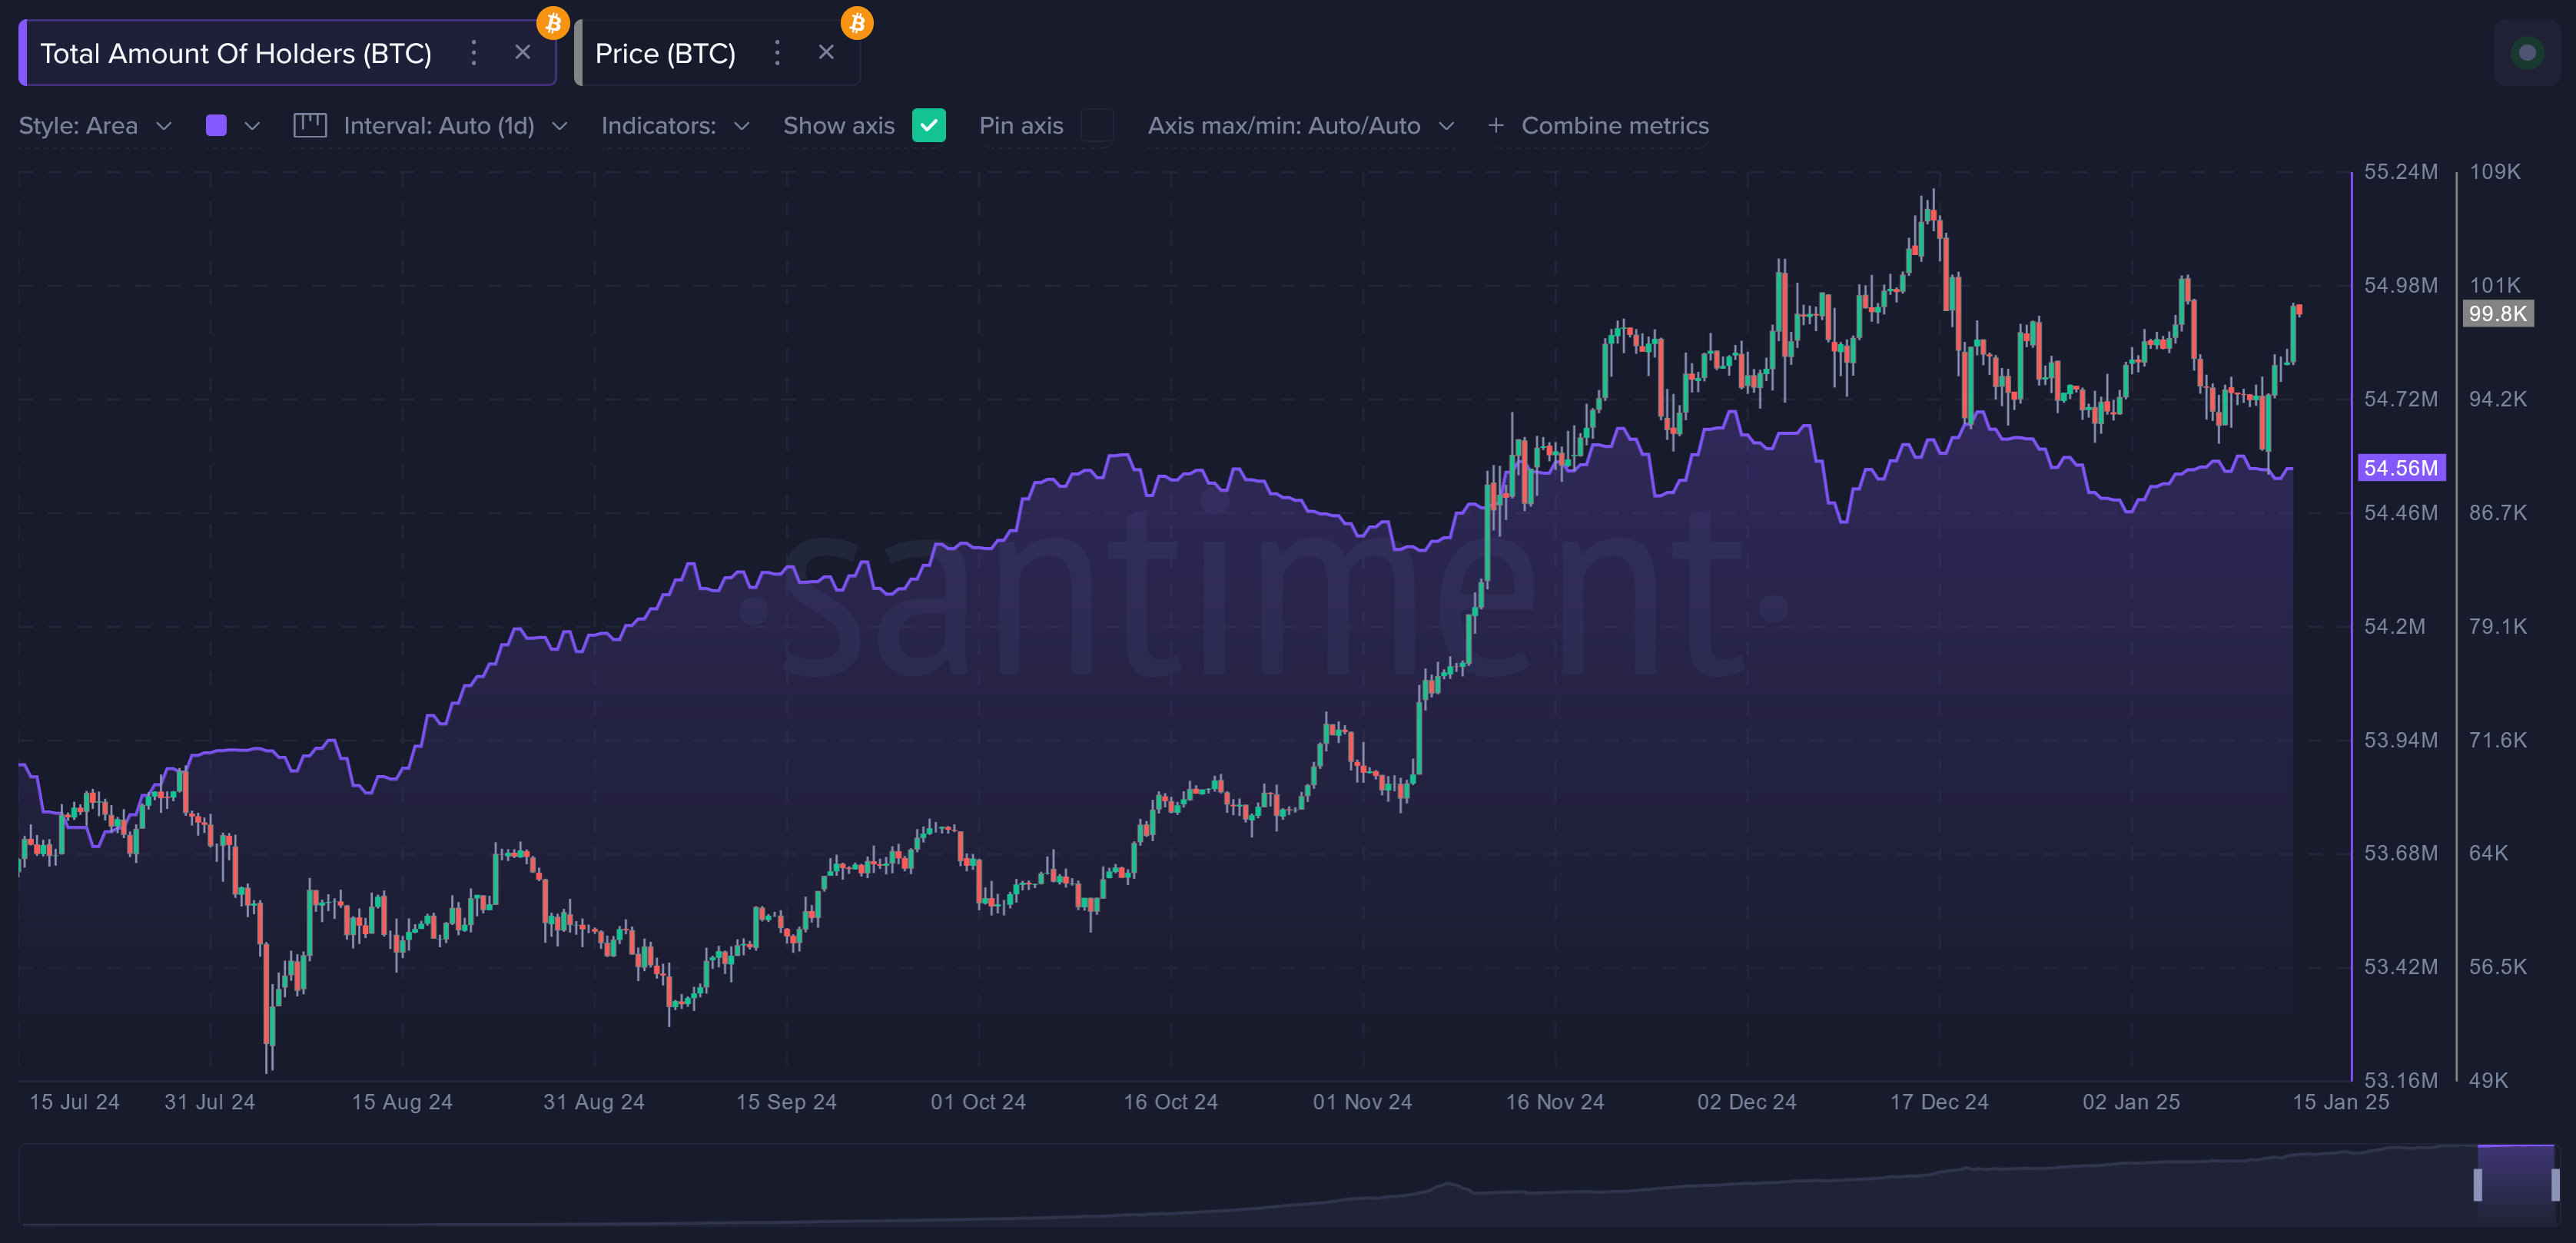
Bitcoin non-empty wallets chart. Source: Santiment
Lastly, traders should watch how conversations across social media are shifting between Layer 1’s, Layer 2’s, and meme coins. Market tops often occur when voices and interests are drawn toward speculative assets with little intrinsic value or development teams. On the contrary, when Bitcoin and blue-chip assets are getting most of the attention, it is a sign that healthy crypto growth may be on the horizon.
As shown in the graph below, the level of discussions toward the projects for Layer 1 and Layer 2 is in the middle of the road. But it is encouraging that the crowd has not been showing much Fear Of Missing Out (FOMO) toward meme coins after major dumps rocked traders over the past 4 weeks if this trend can continue after markets have shown signs of a legitimate rebound.
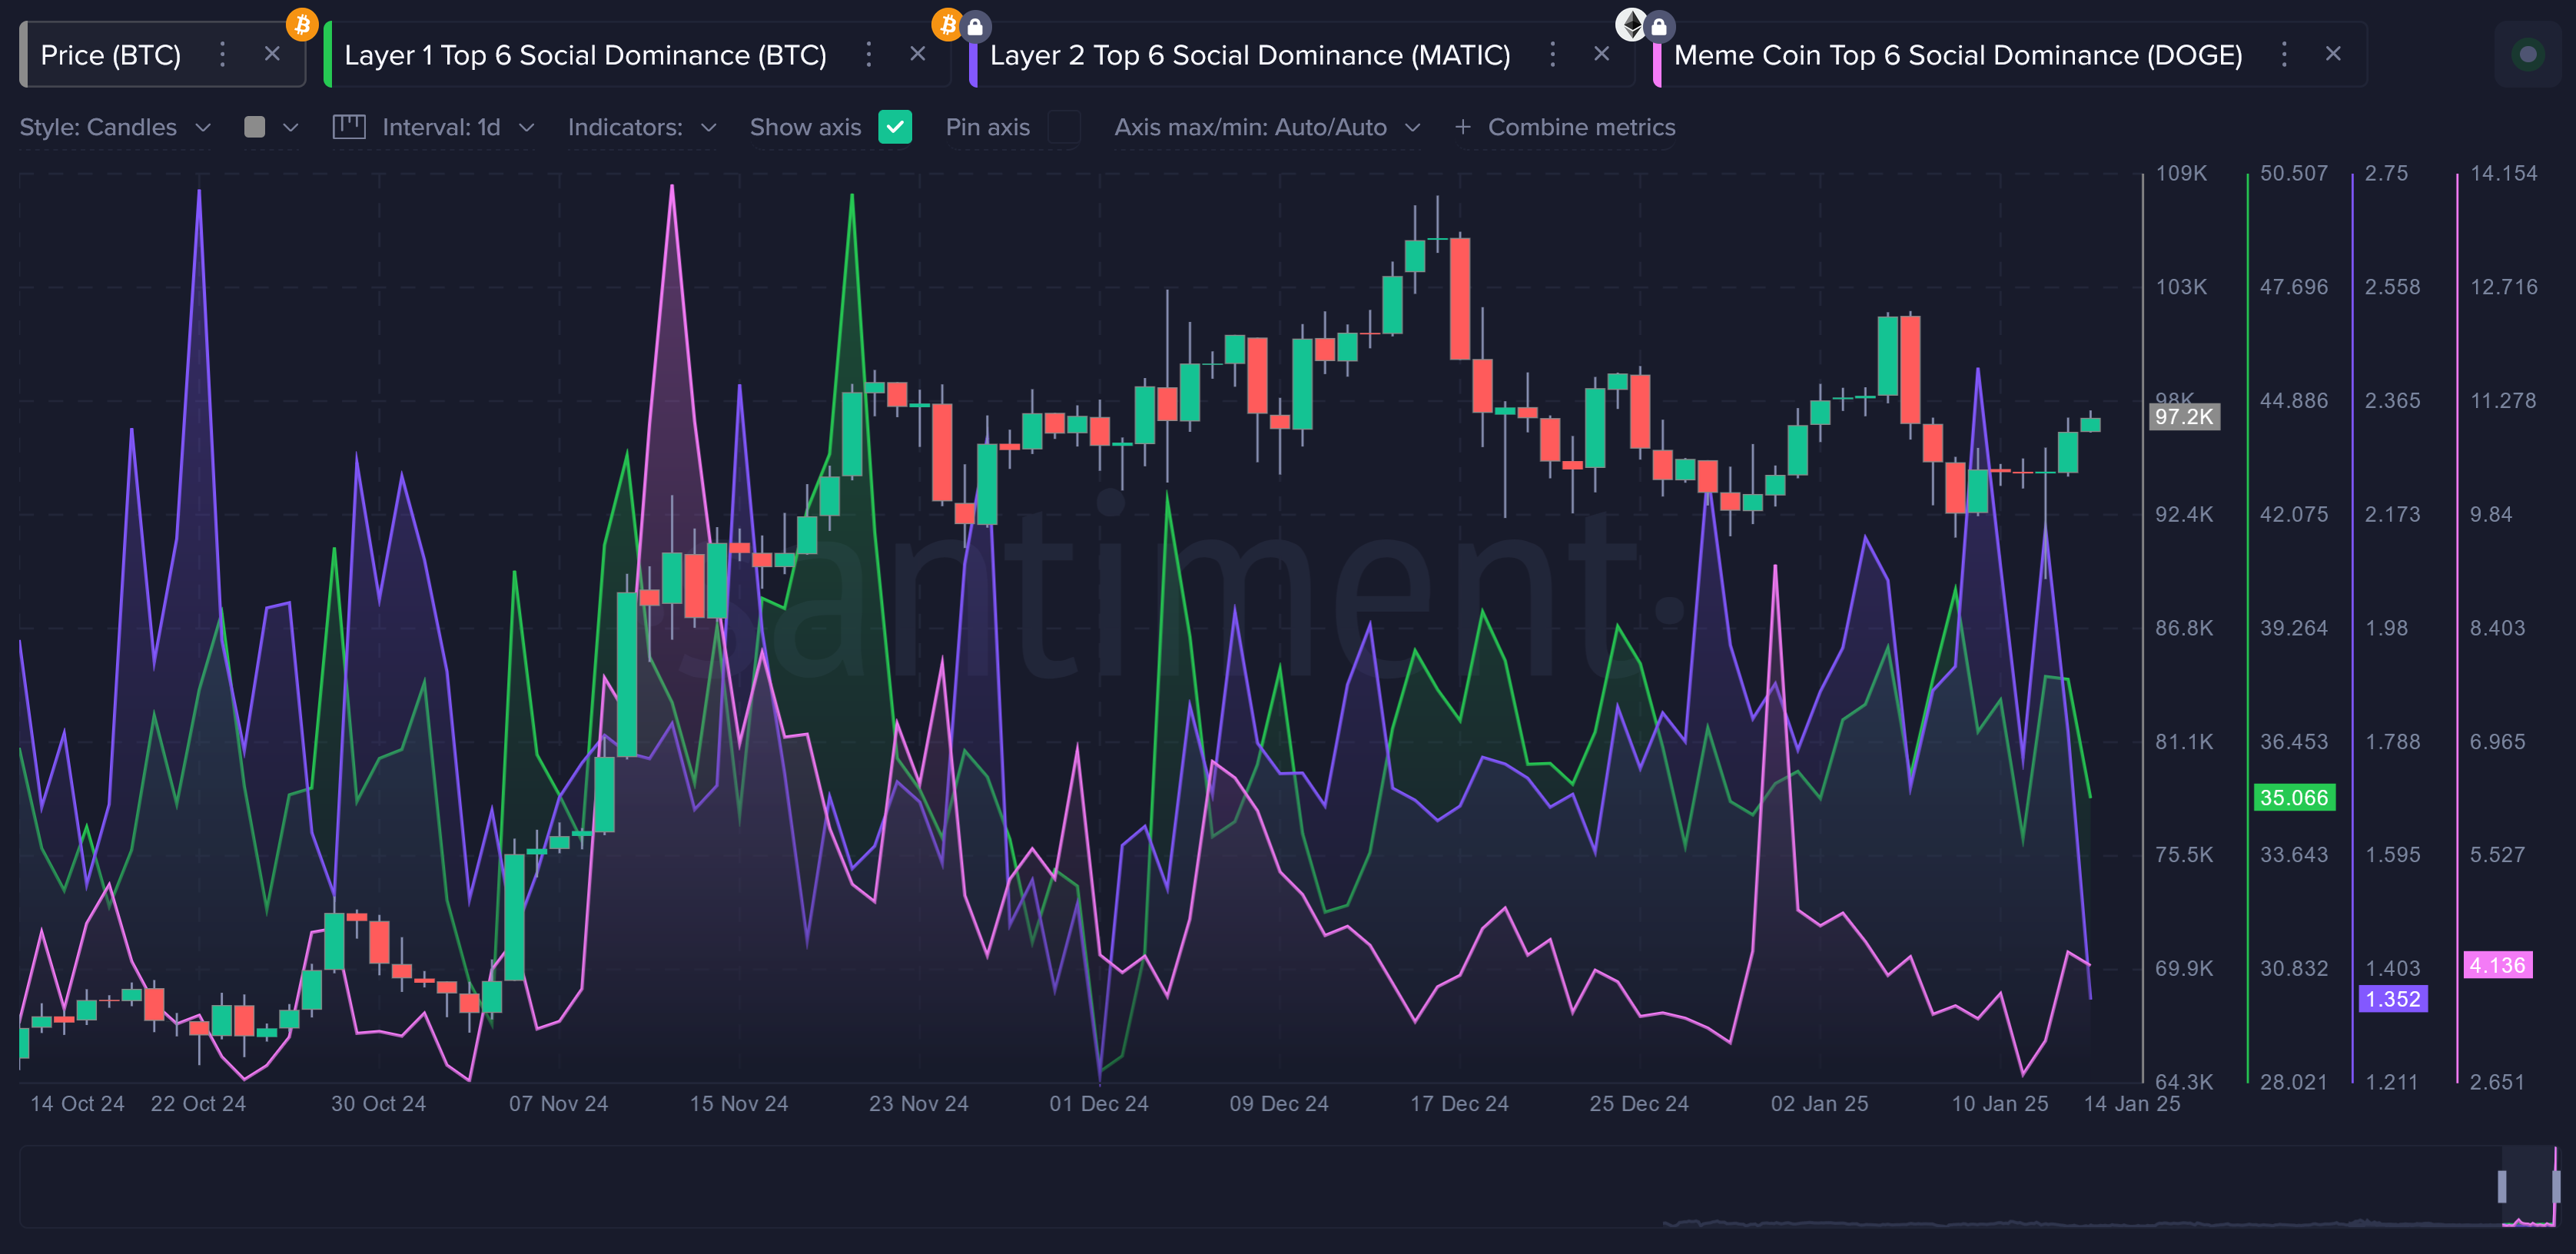
Social Dominance chart. Source: Santiment
Bitcoin bull aims for its all-time high of $108,353
Bitcoin price bounced after retesting its $90,000 support level on Monday and rose 5.77%, closing above the $100K barrier in the next three days. At the time of writing on Friday, it continues to trade higher, around $102,000.
If BTC continues its upward momentum, it could extend the rally to retest the December 17, 2024, all-time high of $108,353.
The Relative Strength Index (RSI) indicator on the daily chart reads 61, above its neutral level of 50, and points upwards, indicating a rise in bullish momentum. Additionally, the Moving Average Convergence Divergence (MACD) indicator flipped a bullish crossover on Wednesday, giving a buy signal and suggesting an uptrend.
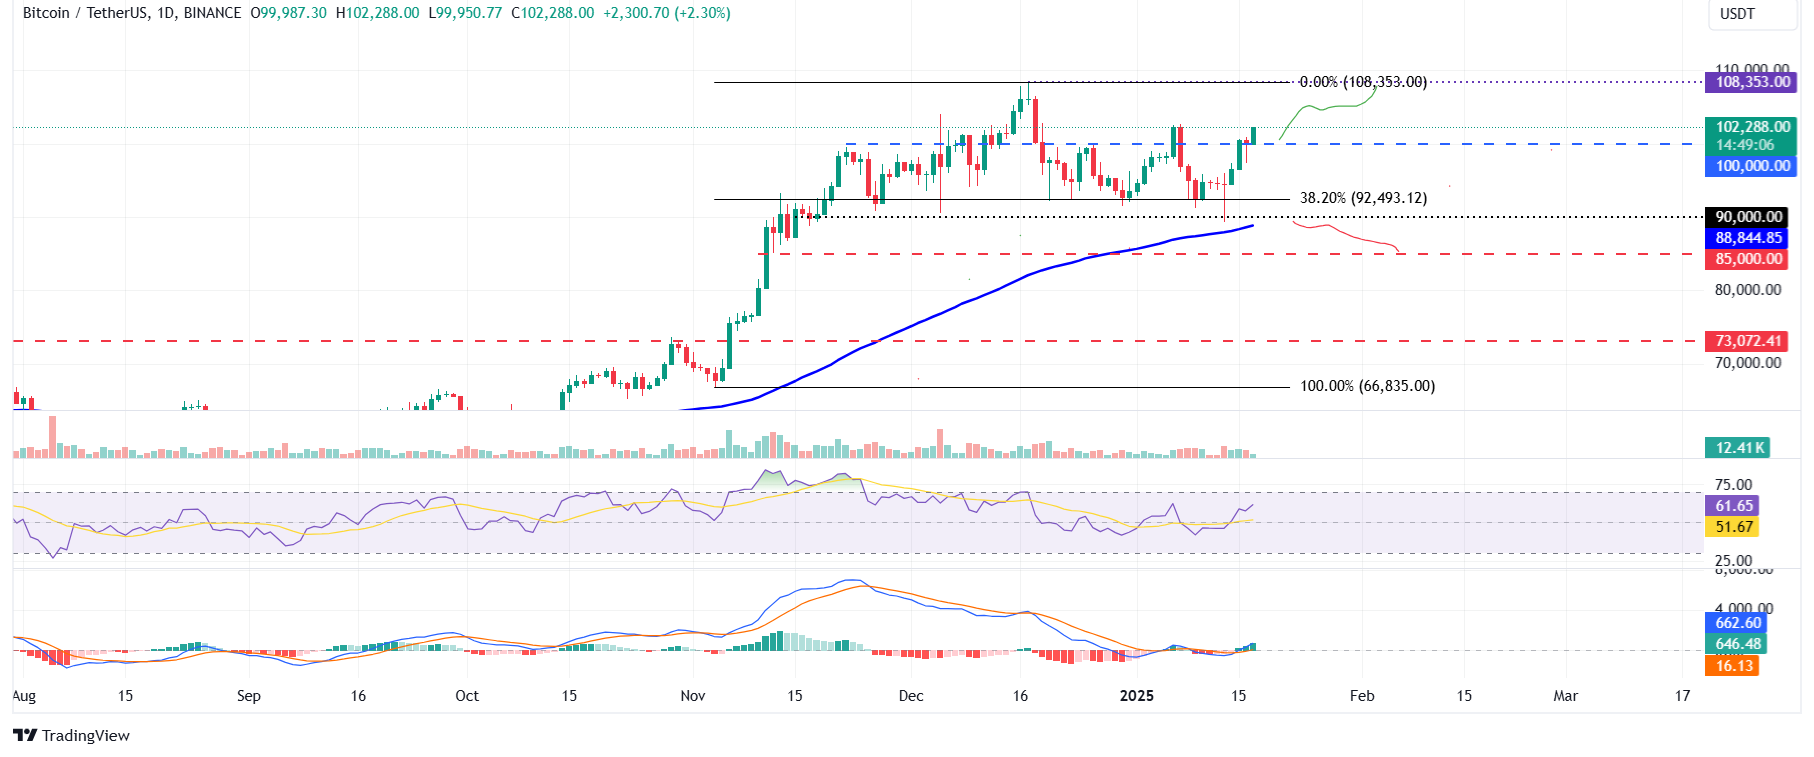
BTC/USDT daily chart
However, if BTC faces a pullback and closes below the $100,000 support level, it could extend the decline to retest its next support level at $90,000.
Bitcoin, altcoins, stablecoins FAQs
Bitcoin is the largest cryptocurrency by market capitalization, a virtual currency designed to serve as money. This form of payment cannot be controlled by any one person, group, or entity, which eliminates the need for third-party participation during financial transactions.
Altcoins are any cryptocurrency apart from Bitcoin, but some also regard Ethereum as a non-altcoin because it is from these two cryptocurrencies that forking happens. If this is true, then Litecoin is the first altcoin, forked from the Bitcoin protocol and, therefore, an “improved” version of it.
Stablecoins are cryptocurrencies designed to have a stable price, with their value backed by a reserve of the asset it represents. To achieve this, the value of any one stablecoin is pegged to a commodity or financial instrument, such as the US Dollar (USD), with its supply regulated by an algorithm or demand. The main goal of stablecoins is to provide an on/off-ramp for investors willing to trade and invest in cryptocurrencies. Stablecoins also allow investors to store value since cryptocurrencies, in general, are subject to volatility.
Bitcoin dominance is the ratio of Bitcoin's market capitalization to the total market capitalization of all cryptocurrencies combined. It provides a clear picture of Bitcoin’s interest among investors. A high BTC dominance typically happens before and during a bull run, in which investors resort to investing in relatively stable and high market capitalization cryptocurrency like Bitcoin. A drop in BTC dominance usually means that investors are moving their capital and/or profits to altcoins in a quest for higher returns, which usually triggers an explosion of altcoin rallies

