Bitcoin Forecast Forecast: BTC falls below $92,000 as exchanges show overheating conditions
Bitcoin price today: $91,800
- Bitcoin price edges below $92,000 on Monday after declining almost 4% last week.
- CryptoQuant data shows that BTC is getting overheated in exchanges.
- QCP’s Capital report highlights that the US economy is heating up, and this week’s macro data releases could be a real test for crypto markets.
Bitcoin (BTC) continues its ongoing correction, falling below $92,000 on Monday after declining almost 4% last week. CryptoQuant data shows that BTC is overheating in exchanges and suggests further decline ahead. A QCP’s Capital report highlights that the US economy is heating up, and this week’s macro data releases could be a real test for cryptos to step up as an inflation hedge.
Bitcoin shows signs of overheating
Bitcoin price extends its decline, trading below $92,000 at the time of writing on Monday after falling almost 4% in the previous week. According to CryptoQuant’s Estimated Leverage Ratio (ELR), Bitcoin is getting overheated. This on-chain indicator is calculated by dividing the open interest of Bitcoin futures by Bitcoin exchange reserves.
In Bitcoin’s case, the metric shows elevated values for four exchanges (Gate.io, Bybit, Deribit, and HTX Global). A high ELR suggests that the chances of correction remain high to reduce leverage, signaling traders to exercise caution.
-638723645646566834.png)
BTC: Estimated Leverage Ratio chart. Source: CryptoQuant
QCP’s Capital report on Monday highlights that the crypto market isn’t out of the woods yet. The report explains that the US economy is showing signs of overheating.
The recent data on Friday showed that the Non-Farm Employment Change print was 256k, far surpassing the forecasted 160k. After last week’s macro data, expectations of interest rate cuts by the Federal Reserve (Fed) have decreased. Moreover, potential President-elect Donald Trump-era tariffs have also ignited more inflation fears, causing the central bank to have to keep rates higher for longer.
“Despite the macro headwinds and lingering Silkroad fud, crypto has found some footing as $91K support still remains intact for now. Implied vols are also at relatively modest levels and drifting lower, with only a slight Put skew on the front end persisting until after Trump’s inauguration,” says QCP’s analyst.
Lastly, the report concluded that the macro storm cloud still looms with the Producer Price Index (PPI) on Tuesday, the Consumer Price Index (CPI) on Wednesday and Unemployment Claims on Thursday on the horizon, potentially adding fuel to the fire. As the US economy heats up, this week could be a real test for crypto to step up as an inflation hedge.
Bitcoin’s institutional demand shows mild recovery
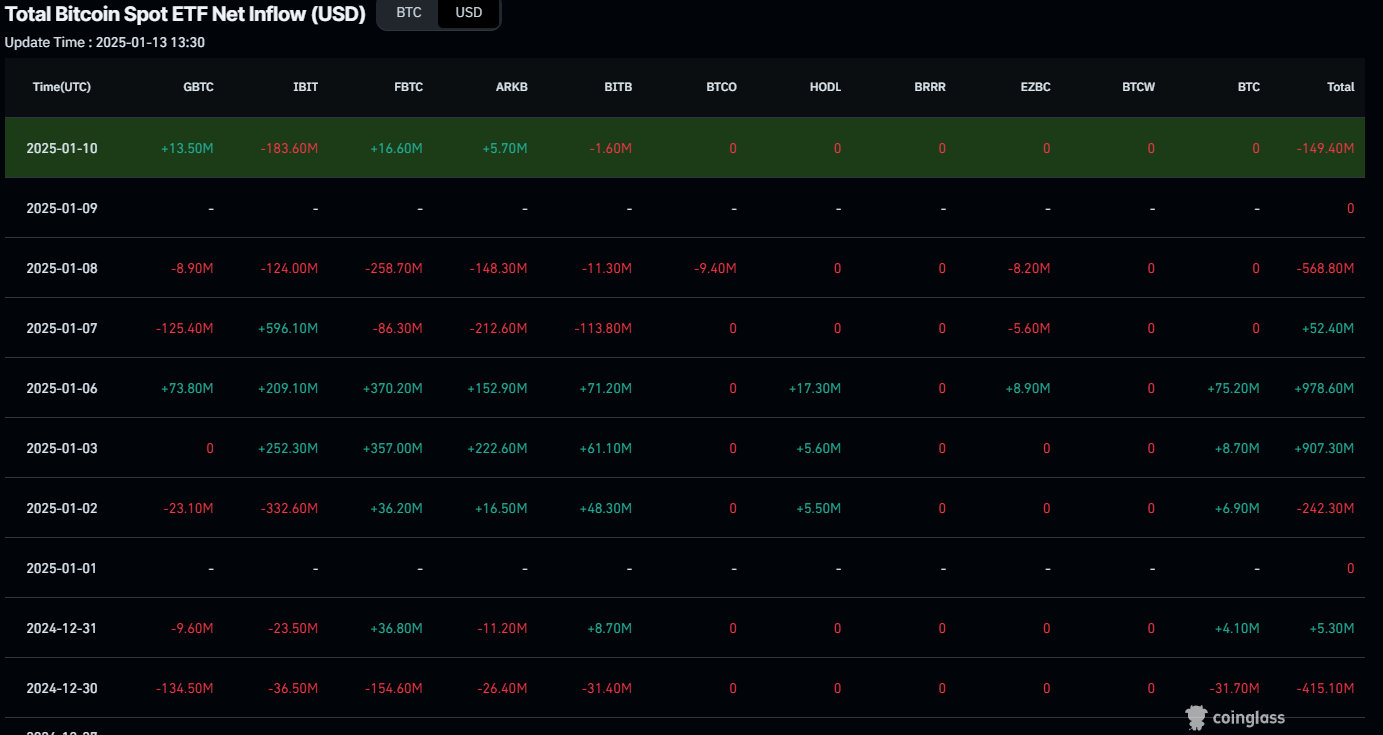
Looking down, institutional demand shows a slight sign of recovery after being skewed over the past four weeks, likely due to the holiday season. According to Coinglass, Bitcoin spot Exchange Traded Funds (ETFs) data recorded a total net inflow of $312.8 million last week, a mild rise compared to the previous week’s inflow of $255.2 million. However, as traders and investors return, these dynamics could shift significantly, leading to a stronger magnitude of inflows, as seen in early December.

Total Bitcoin spot ETF Net Inflow chart. Source: Coinglass
According to a Bitcoin Magazine tweet on Sunday, Scott Bessent, the crypto-friendly nominee for Treasury Secretary in the Trump administration, has been disclosed to own $500K worth of Bitcoin ETF.
JUST IN: Trump’s Treasury pick Scott Bessent disclosed owning up to $500,000 worth of #Bitcoin ETF. pic.twitter.com/UjFt4mo7SI
— Bitcoin Magazine (@BitcoinMagazine) January 12, 2025
Bitcoin Price Forecast: BTC bears aim for $90K mark
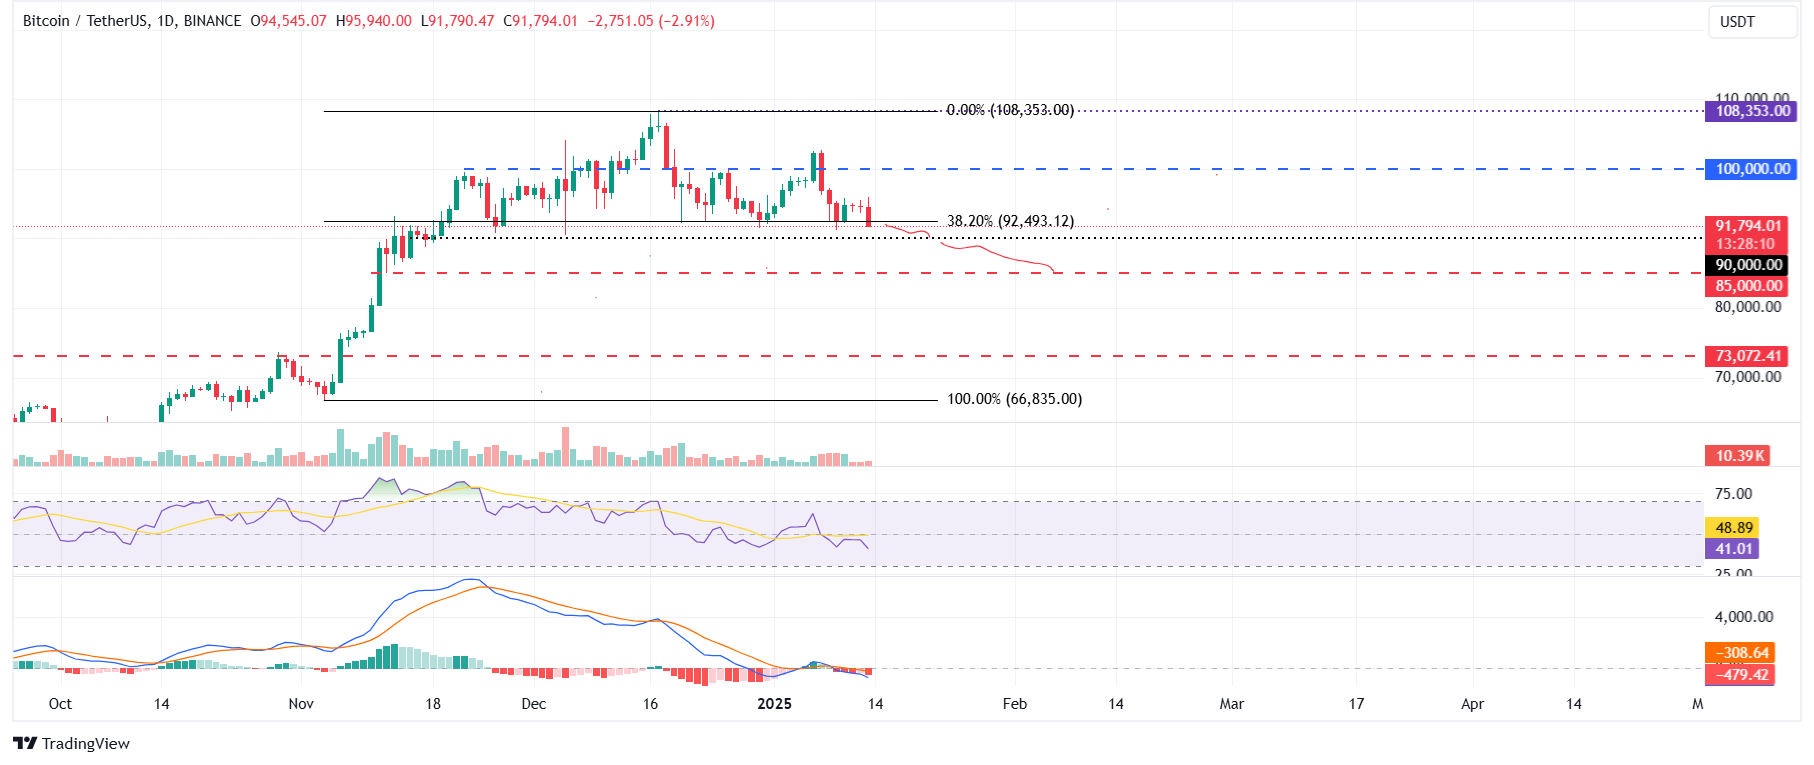
Bitcoin price failed to sustain above the $100K mark on January 7 and declined near 10% till Thursday. However, on Friday, BTC bounced 2.35% from its 38.20% Fibonacci retracement level at $92,493(drawn from the November 4 low of $66,835 to the December 17 high of $108,353) and hovered around the $94,500 level in the next two days. At the time of writing on Monday, it trades slightly down, breaking below the $92,493 support level.
If BTC closes below $92,493, it could extend the decline to test the psychological level of $90,000. A successful close below $90,000 would extend an additional decline to retest its next support level at $85,000.
The Relative Strength Index on the daily chart read 41, below its neutral level of 50, indicating bearish momentum. The Moving Average Convergence Divergence (MACD) indicator also shows a bearish crossover on Wednesday, suggesting a sell signal and a downtrend.

BTC/USDT daily chart
Conversely, if BTC recovers and closes above the $100,000 level, it could extend the rally to retest the December 17, 2024, all-time high of $108,353.
Bitcoin, altcoins, stablecoins FAQs
Bitcoin is the largest cryptocurrency by market capitalization, a virtual currency designed to serve as money. This form of payment cannot be controlled by any one person, group, or entity, which eliminates the need for third-party participation during financial transactions.
Altcoins are any cryptocurrency apart from Bitcoin, but some also regard Ethereum as a non-altcoin because it is from these two cryptocurrencies that forking happens. If this is true, then Litecoin is the first altcoin, forked from the Bitcoin protocol and, therefore, an “improved” version of it.
Stablecoins are cryptocurrencies designed to have a stable price, with their value backed by a reserve of the asset it represents. To achieve this, the value of any one stablecoin is pegged to a commodity or financial instrument, such as the US Dollar (USD), with its supply regulated by an algorithm or demand. The main goal of stablecoins is to provide an on/off-ramp for investors willing to trade and invest in cryptocurrencies. Stablecoins also allow investors to store value since cryptocurrencies, in general, are subject to volatility.
Bitcoin dominance is the ratio of Bitcoin's market capitalization to the total market capitalization of all cryptocurrencies combined. It provides a clear picture of Bitcoin’s interest among investors. A high BTC dominance typically happens before and during a bull run, in which investors resort to investing in relatively stable and high market capitalization cryptocurrency like Bitcoin. A drop in BTC dominance usually means that investors are moving their capital and/or profits to altcoins in a quest for higher returns, which usually triggers an explosion of altcoin rallies.

