Cardano breaks above descending trendline, eyes April high as bullish momentum builds

출처 Fxstreet
  • Cardano extends gains on Friday, following a close above a descending trendline the previous day.
  • Technical indicators and on-chain data show bullish momentum, suggesting a rally ahead.
  • A daily candlestick close below $0.361 would invalidate the bullish thesis.

Cardano (ADA) extends its gains on Friday, trading 5% higher at the time of writing after rallying 12% and closing above its descending trendline on Thursday. The technical outlook and on-chain metrics support ADA’s rise, which shows that bullish momentum is gaining traction and suggests a continuation of the rally.

Cardano bulls eye for April high

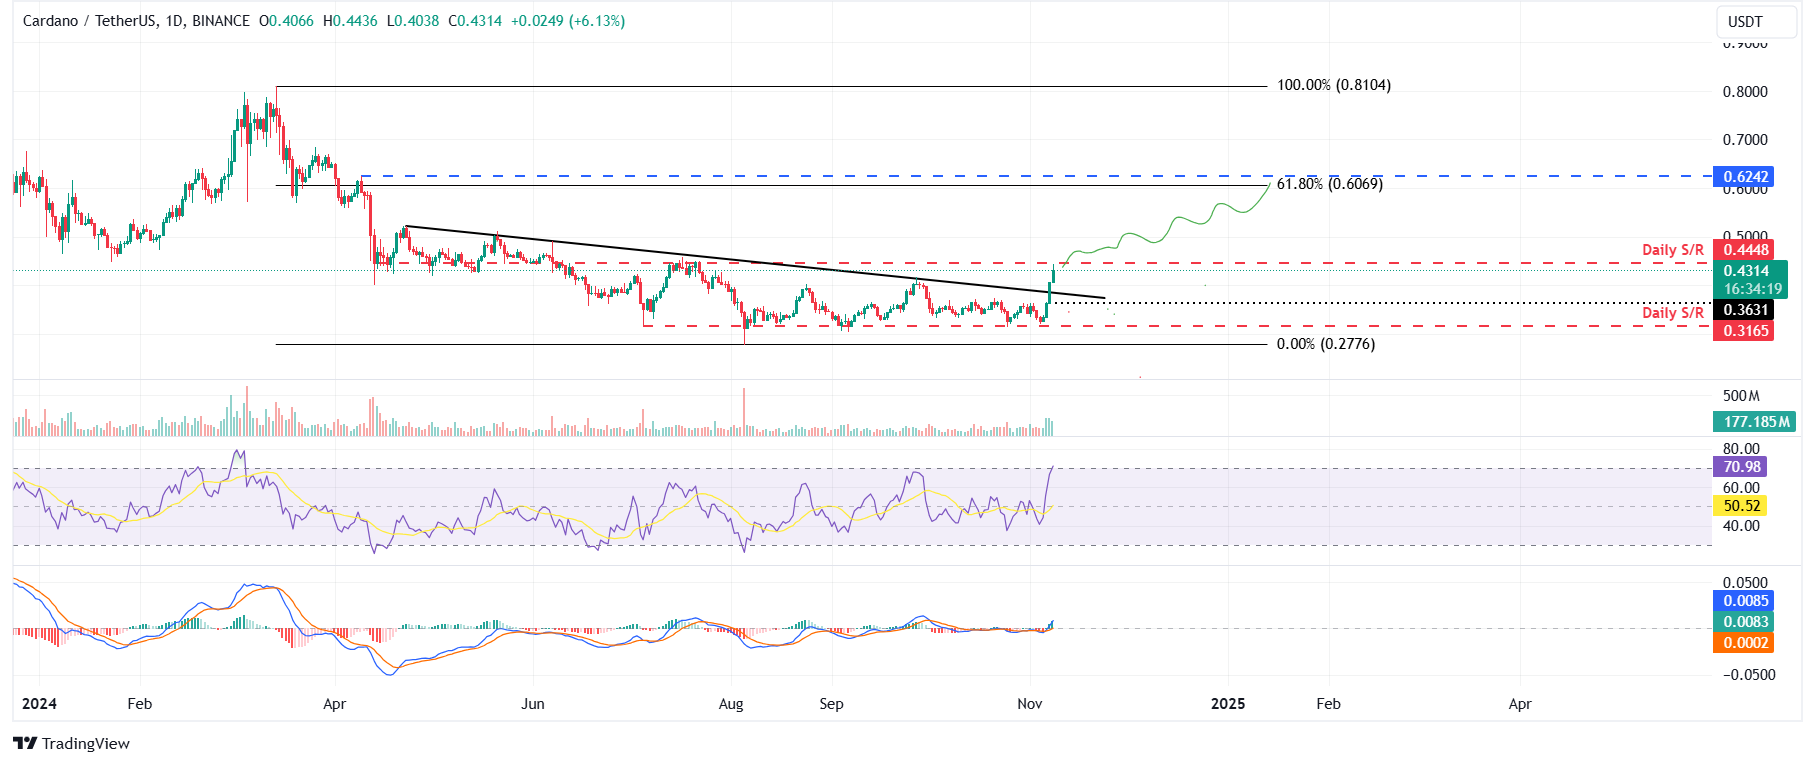
Cardano price broke and closed above a descending trendline (drawn by connecting multiple highs since the end of April) on Thursday. At the time of writing on Friday, it continues to edge higher around $0.431.

If ADA maintains its upward momentum and closes above its daily resistance at $0.445, it could extend the rally by 45% from its current level to retest its April 9 high of $0.624, which roughly coincides with the 61.8% Fibonacci retracement level (drawn from March high of $0.810 to an August low of $0.277) at $0.606.

The Moving Average Convergence Divergence (MACD) indicator further supports Cardano’s rise, signaling a bullish crossover on Thursday’s daily chart. The MACD line (blue line) moved above the signal line (yellow line), giving a buy signal. However, the Relative Strength Index (RSI) stands at 70, entering overbought conditions. Traders should be cautious of adding new long positions because the chances of a price pullback increase.
Cardano extends gains on Friday, following a close above a descending trendline the previous day. Technical indicators and on-chain data show bullish momentum, suggesting a rally ahead. A daily candlestick close below $0.361 would invalidate the bullish thesis.  Cardano (ADA) extends its gains on Friday, trading 5% higher at the time of writing after rallying 12% and closing above its descending trendline on Thursday. The technical outlook and on-chain metrics support ADA’s rise, which shows that bullish momentum is gaining traction and suggests a continuation of the rally.  Cardano bulls eye for April high  Cardano price broke and closed above a descending trendline (drawn by connecting multiple highs since the end of April) on Thursday. At the time of writing on Friday, it continues to edge higher around $0.431.  If ADA maintains its upward momentum and closes above its daily resistance at $0.445, it could extend the rally by 45% from its current level to retest its April 9 high of $0.624, which roughly coincides with the 61.8% Fibonacci retracement level (drawn from March high of $0.810 to an August low of $0.277) at $0.606.  The Moving Average Convergence Divergence (MACD) indicator further supports Cardano’s rise, signaling a bullish crossover on Thursday’s daily chart. The MACD line (blue line) moved above the signal line (yellow line), giving a buy signal. However, the Relative Strength Index (RSI) stands at 70, entering overbought conditions. Traders should be cautious of adding new long positions because the chances of a price pullback increase.  ADA/USDT daily chart  Cardano’s on-chain data further supports the bullish thesis. Coinglass’s data shows that the futures’ Open Interest (OI) in Cardano at exchanges is increasing. Increasing OI represents new or additional money entering the market and new buying, which suggests a bullish trend.   The graph below shows that ADA’s OI increased from $217.71 million on Wednesday to $329.01 million on Friday, the highest level since mid-April. ADA Open Interest chart. Source: Coinglass  Santiment’s Age Consumed index aligns with the bullish outlook noted from the technical perspective. Spikes in this index suggest dormant tokens (tokens stored in wallets for a long time) are in motion and can be used to spot short-term local tops or bottoms.  For ADA, history shows that the spikes at the Age Consumed index were followed by a rally in Cardano’s price. The most recent uptick on Wednesday also forecasted that ADA was ready for an uptrend.  ADA Age Consumed index chart. Source: Santiment  Despite the bullish thesis signaled by both on-chain data and technical analysis, the outlook will shift to bearish if Cardano's daily candlestick closes below Thursday's low of $0.361. This scenario could lead to a 12.40% crash to retest its daily support at $0.316.

ADA/USDT daily chart

Cardano’s on-chain data further supports the bullish thesis. Coinglass’s data shows that the futures’ Open Interest (OI) in Cardano at exchanges is increasing. Increasing OI represents new or additional money entering the market and new buying, which suggests a bullish trend. 

The graph below shows that ADA’s OI increased from $217.71 million on Wednesday to $329.01 million on Friday, the highest level since mid-April.

ADA Open Interest chart. Source: Coinglass

ADA Open Interest chart. Source: Coinglass

Santiment’s Age Consumed index aligns with the bullish outlook noted from the technical perspective. Spikes in this index suggest dormant tokens (tokens stored in wallets for a long time) are in motion and can be used to spot short-term local tops or bottoms.

For ADA, history shows that the spikes at the Age Consumed index were followed by a rally in Cardano’s price. The most recent uptick on Wednesday also forecasted that ADA was ready for an uptrend.

ADA Age Consumed index chart. Source: Santiment

ADA Age Consumed index chart. Source: Santiment

Despite the bullish thesis signaled by both on-chain data and technical analysis, the outlook will shift to bearish if Cardano's daily candlestick closes below Thursday's low of $0.361. This scenario could lead to a 12.40% crash to retest its daily support at $0.316.

면책 조항: 정보 제공 목적으로만 사용됩니다. 과거 성과가 미래 결과를 보장하지 않습니다.
placeholder
리플 가격 연간 전망: XRP, 2025년에 새로운 고점에 도달할 수 있을까?리플(XRP)은 2024년 처음 10개월 동안 2021년 5월에 겪은 급격한 하락 이후 지속된 통합 패턴을 연장했습니다.
저자  FXStreet
2024 년 12 월 23 일
리플(XRP)은 2024년 처음 10개월 동안 2021년 5월에 겪은 급격한 하락 이후 지속된 통합 패턴을 연장했습니다.
placeholder
도지코인 가격 전망: 대형 투자자 거래 70% 이상 감소, 약세 흐름 지속될 가능성도지코인(DOGE), 지난주 7% 이상 하락 후 0.24달러선에서 약세 지속.
저자  FXStreet
2 월 10 일 월요일
도지코인(DOGE), 지난주 7% 이상 하락 후 0.24달러선에서 약세 지속.
placeholder
솔라나 가격 전망: 30억 달러 규모 락업 해제 우려 속 ETF 기대감에 상승솔라나(SOL), 30억 달러 규모 토큰 락업 해제 우려 속 화요일 1% 하락.
저자  FXStreet
2 월 12 일 수요일
솔라나(SOL), 30억 달러 규모 토큰 락업 해제 우려 속 화요일 1% 하락.
placeholder
비트코인, 금과 S&P 500이 사상 최고치 기록하는 동안 부진목요일, 비트코인 (BTC)은 98,000달러를 넘어 거래되며 범위 내에서의 움직임을 지속했습니다. 한편, 금과 S&P 500을 포함한 전통 자산들은 새로운 최고치를 기록했습니다.
저자  FXStreet
어제 02: 06
목요일, 비트코인 (BTC)은 98,000달러를 넘어 거래되며 범위 내에서의 움직임을 지속했습니다. 한편, 금과 S&P 500을 포함한 전통 자산들은 새로운 최고치를 기록했습니다.
placeholder
비트코인, 이더리움, 리플 가격 전망 TOP 3: BTC 변동성 대비, ETH와 XRP는 하락을 막기 위한 싸움비트코인(BTC) 가격, 2월 초 이후 9만4천 달러에서 10만 달러 사이에서 횡보; 조만간 이 횡보 장세가 끝날 수 있다.
저자  FXStreet
23 시간 전
비트코인(BTC) 가격, 2월 초 이후 9만4천 달러에서 10만 달러 사이에서 횡보; 조만간 이 횡보 장세가 끝날 수 있다.
goTop
quote