

Bitcoin Price Forecast: Retraces to around $75,000 after hitting new all-time high
Bitcoin price today: $74,900
- Bitcoin rallied to a fresh all-time high of $76,400 on Wednesday as crypto-friendly candidate Donald Trump won the US presidential election.
- Institutional demand returned on Wednesday, with a $621.90 million inflow in US spot Bitcoin ETFs.
- Profit-taking and realized losses remain minimal compared to the volume seen during the previous all-time high, suggesting room for further upside.
Bitcoin (BTC) edges slightly down on Thursday and trades at around $74,900 after hitting a new all-time high (ATH) of $76,400 on Wednesday, buoyed by the victory of the crypto-friendly candidate Donald Trump in the US presidential election.
Institutional demand resumed on Wednesday, recording an inflow of over $620 million in US spot Bitcoin Exchange Traded Funds (ETFs) after three consecutive days of outflows ahead of the US presidential election. Reports highlight the rise in capital inflow, but profit-taking and realized losses remain relatively low compared to the volume seen during the previous ATH registered in March, suggesting that Bitcoin still has room for further upside.
Trump’s victory leads to a new all-time high
Bitcoin broke its all-time high of $73,777 on Wednesday, reaching a fresh high of $76,400. This milestone has generated excitement among investors, as BTC is now in a price discovery mode and could point higher in the near future. The swiping victory of Donald Trump as the 47th president of the United States has been perceived as a catalyst for Bitcoin’s price rally. His pro-Bitcoin stance and proposed policies, such as eliminating taxes on Bitcoin transactions and establishing a strategic reserve, have sparked bullish sentiment in the crypto community.
The current market environment is characterized by a high level of retail interest and FOMO (Fear Of Missing Out), as many investors are eager to capitalize on Bitcoin’s upward momentum.
Coinglass’s data shows that on Wednesday, $242.10 million worth of short positions in Bitcoin were liquidated (the highest short liquidations at least in six months), contributing to upward price pressure and further fueling the rally.
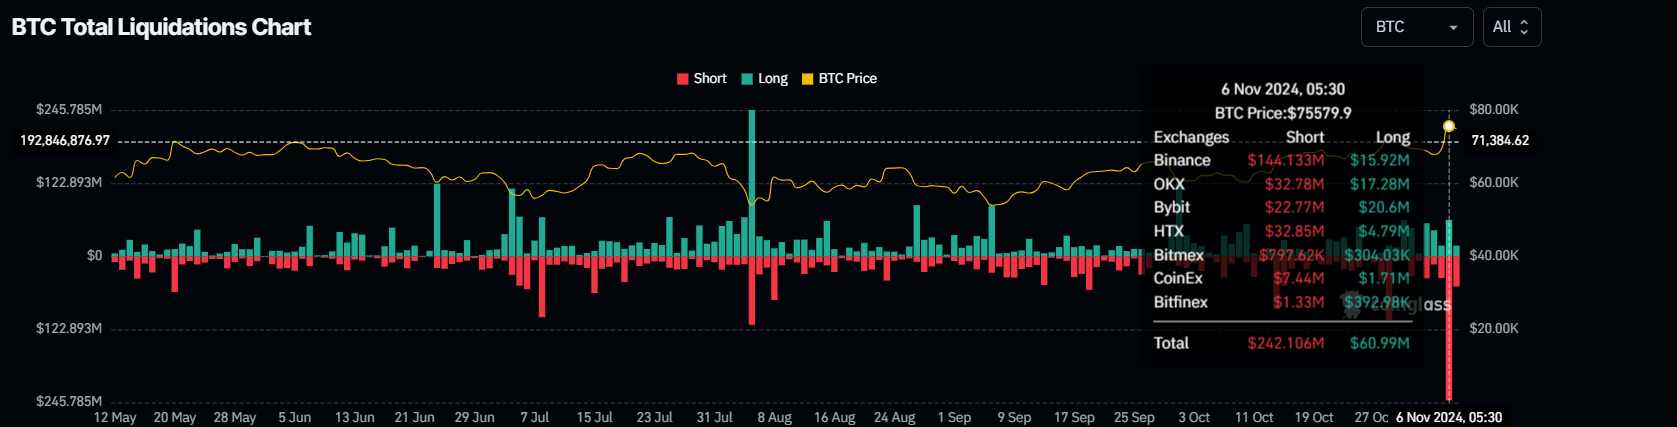
Bitcoin Liquidation chart. Source: Coinglass
Institutional demand returned on Wednesday, according to Coinglass data. US spot ETFs recorded an inflow of $621.90 million on that day after investors appeared to have de-risked in the run-up to the US presidential election, highlighted by the notable outflows across the last three days shown in the graph below. If this inflow trend continues or intensifies, it could further fuel the ongoing Bitcoin price rally.
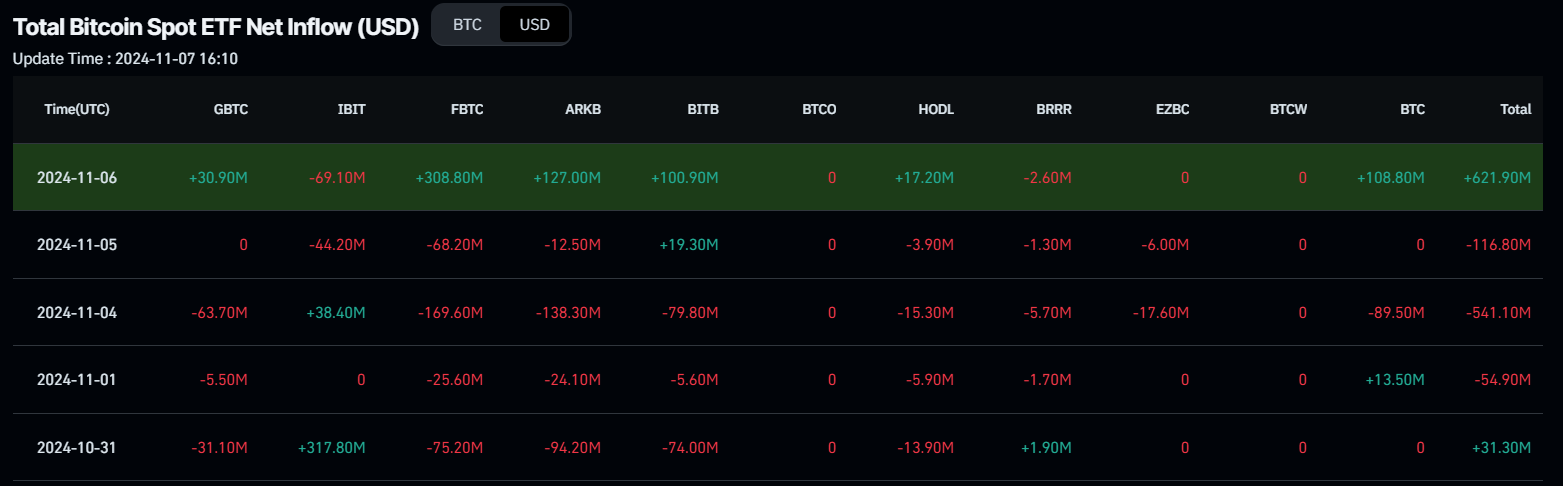
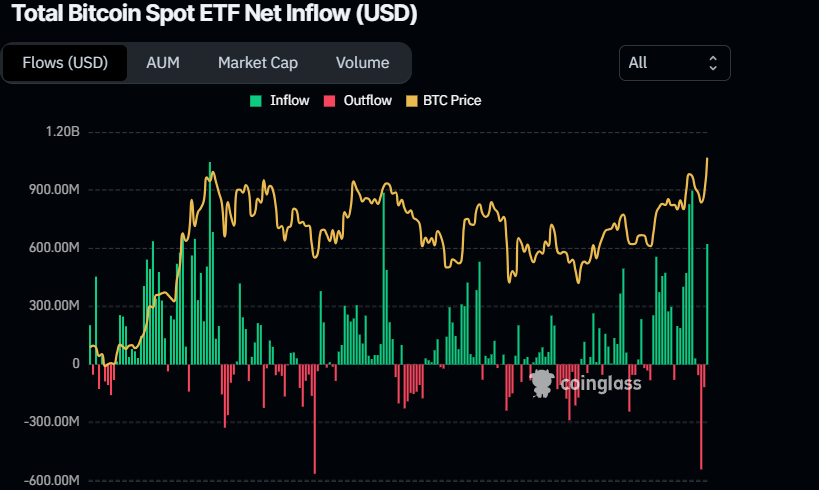
Total Bitcoin Spot ETF Net Inflow chart. Source: Coinglass
Lastly, Glassnode’s weekly report on Wednesday highlights that capital inflow continues to grow, signaling a persistent new demand. Profit-taking activity has increased while losses realized remain minimal. However, both values are relatively low compared to the volume seen during the previous ATH recorded in March.
The report explains that net capital inflows into Bitcoin have increased significantly since early September. This showcases a rising appetite for investors to allocate capital and traders to take profit from market strength.
Bitcoin Realized Cap has increased by 3.8% over the last 30 days, one of the highest inflow levels since January 2023. It is currently trading at an ATH value of $656 billion, supported by a net 30-day capital inflow of $2.5 billion.
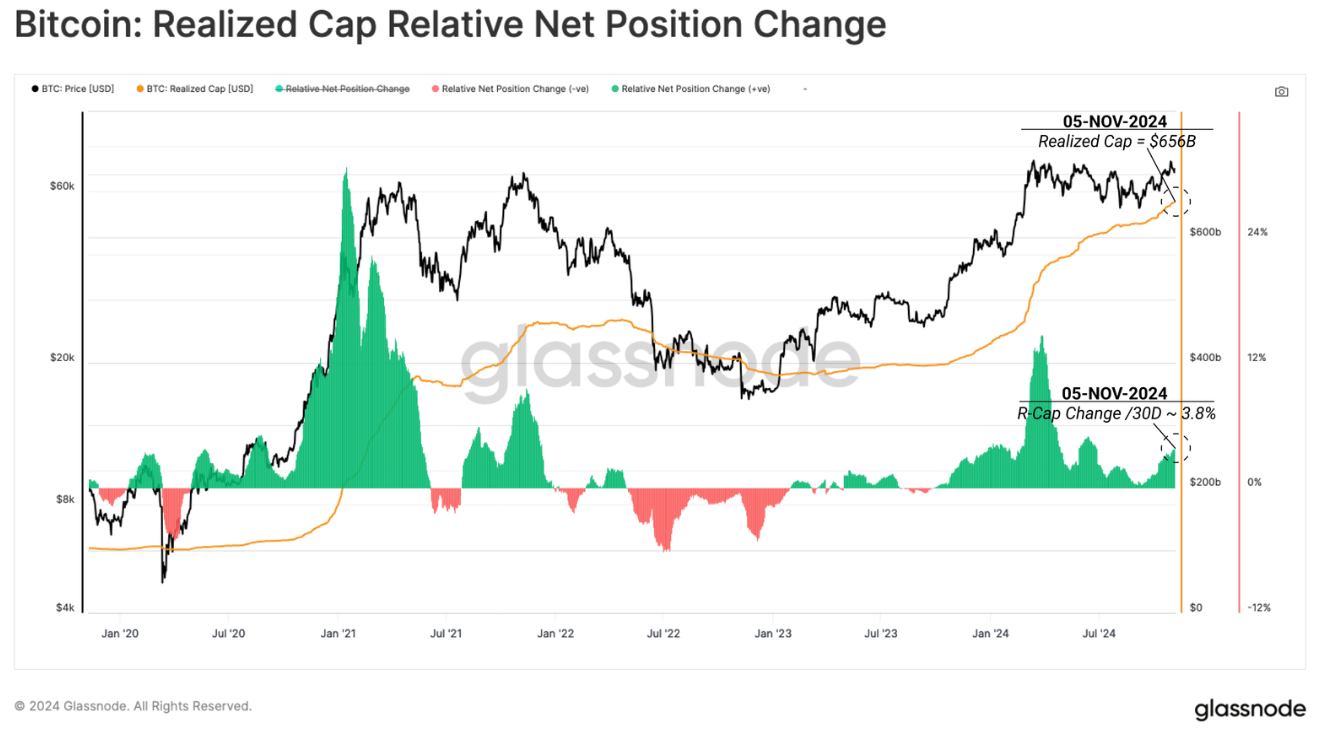
Bitcoin: Realized Cap chart. Source Glassnode
“The explosive wave of profit taking into the March ATH culminated with a peak realized profit volume of +$3.1B. As the market digested this move over the last seven months, realized profit and loss volumes both subsided towards an equilibrium position. This suggests a complete reset of supply and demand forces has occurred.” says the report.
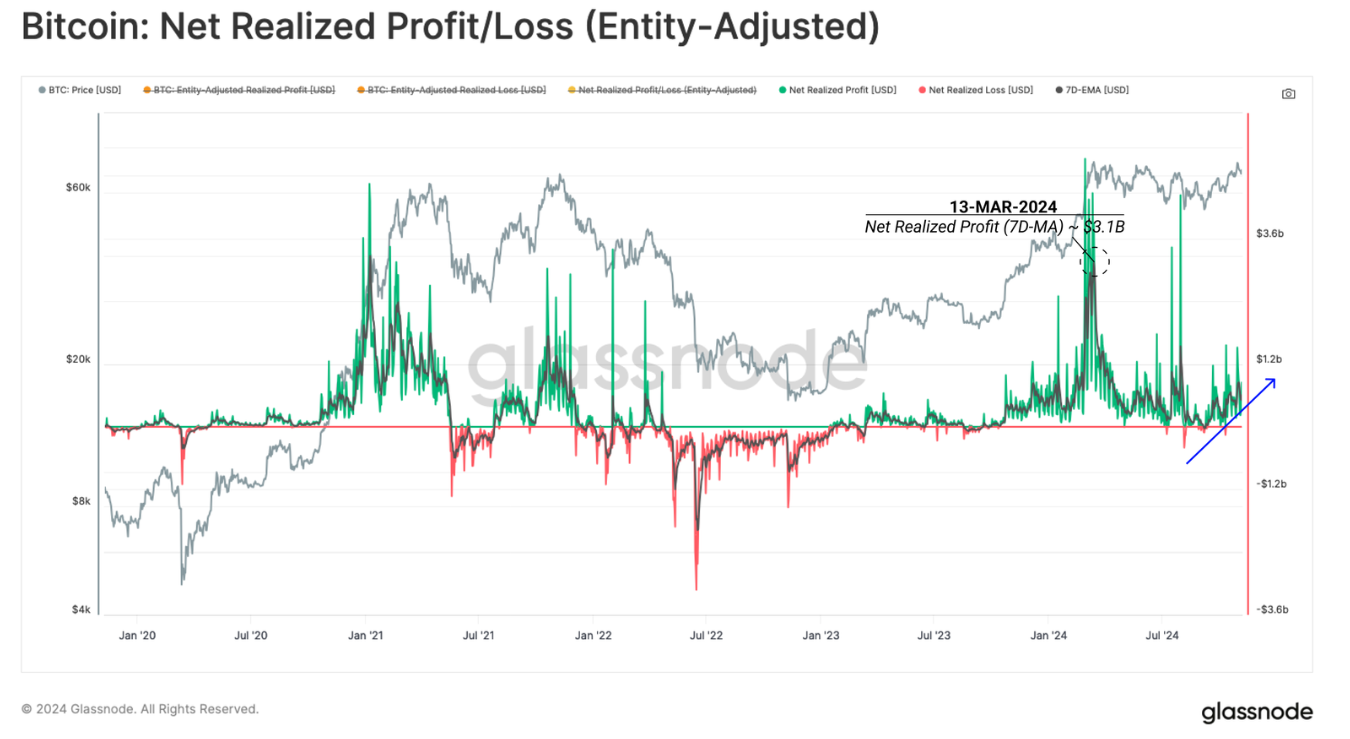
Bitcoin: Net Realized Profit/ Loss chart. Source: Glassnode
Bitcoin Price Forecast: Next target at $78,777
Bitcoin price broke above its previous ATH of $73,777, seen in March, reaching a fresh ATH of $76,400 on Wednesday. At the time of writing on Thursday, it trades slightly down around $74,900.
If Bitcoin continues its upward momentum, it may set the stage for a potential move toward the 141.40% Fibonacci extension level (drawn from July’s high of $70,079 to August’s low of $49,072) at $78,777.
The Moving Average Convergence Divergence (MACD) indicator further supports Bitcoin’s rise, signaling a bullish crossover on Wednesday’s daily chart. The MACD line (blue line) moved above the signal line (yellow line), giving a buy signal. However, the Relative Strength Index (RSI) stands at 67, pointing downwards after rejecting from its overbought level of 70 on Wednesday. Traders should be cautious because the chances of a price pullback are increasing, particularly as the RSI tilts down.
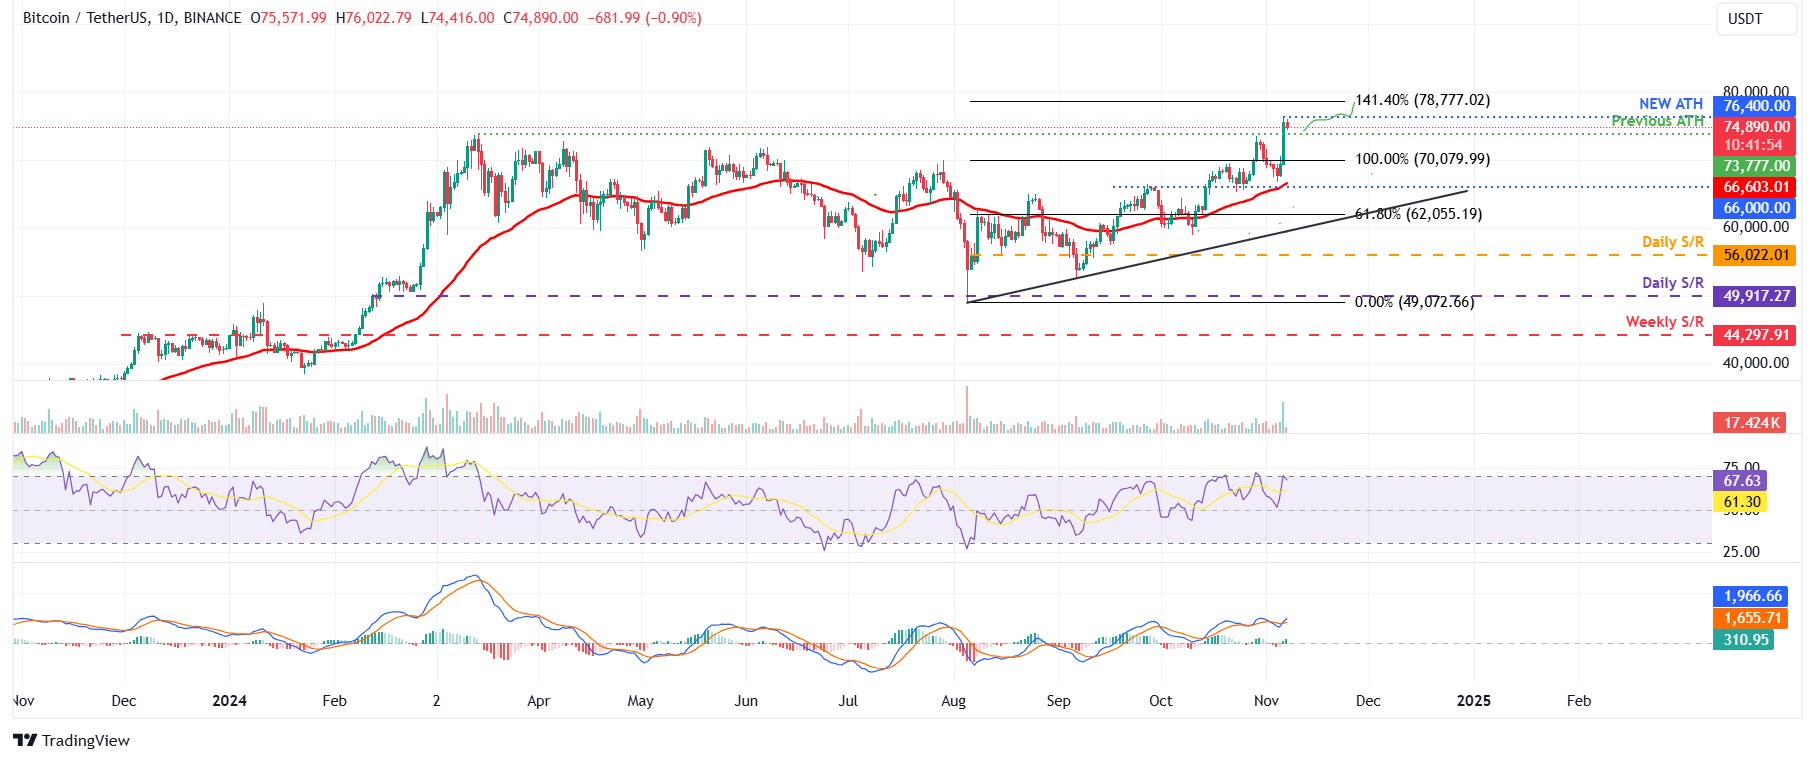
BTC/USDT daily chart
If BTC fails to maintain its upward momentum and extends retracement, closing below $73,777, it could decline further to retest its psychologically important level of $70,000.
Bitcoin, altcoins, stablecoins FAQs
Bitcoin is the largest cryptocurrency by market capitalization, a virtual currency designed to serve as money. This form of payment cannot be controlled by any one person, group, or entity, which eliminates the need for third-party participation during financial transactions.
Altcoins are any cryptocurrency apart from Bitcoin, but some also regard Ethereum as a non-altcoin because it is from these two cryptocurrencies that forking happens. If this is true, then Litecoin is the first altcoin, forked from the Bitcoin protocol and, therefore, an “improved” version of it.
Stablecoins are cryptocurrencies designed to have a stable price, with their value backed by a reserve of the asset it represents. To achieve this, the value of any one stablecoin is pegged to a commodity or financial instrument, such as the US Dollar (USD), with its supply regulated by an algorithm or demand. The main goal of stablecoins is to provide an on/off-ramp for investors willing to trade and invest in cryptocurrencies. Stablecoins also allow investors to store value since cryptocurrencies, in general, are subject to volatility.
Bitcoin dominance is the ratio of Bitcoin's market capitalization to the total market capitalization of all cryptocurrencies combined. It provides a clear picture of Bitcoin’s interest among investors. A high BTC dominance typically happens before and during a bull run, in which investors resort to investing in relatively stable and high market capitalization cryptocurrency like Bitcoin. A drop in BTC dominance usually means that investors are moving their capital and/or profits to altcoins in a quest for higher returns, which usually triggers an explosion of altcoin rallies.
추천 기사


