

Bitcoin Weekly Forecast: Run toward fresh all-time high hinges on US presidential election results
- Bitcoin rises over 2% this week until Friday after flirting with a new all-time high and then correcting.
- Bitcoin may experience a pullback ahead of the US presidential election on Tuesday, a key event for its price outlook in the short, medium and long term.
- US spot Bitcoin ETFs posted over $2.2 billion in inflows until Thursday despite the increased profit-taking activity.
Bitcoin (BTC) rose over 2% this week until Friday, in a stellar first half of the week in which BTC was within a touching distance of a fresh all-time high followed by a significant price drop amid increasing signs of profit-taking.
Bitcoin could experience a price pullback in the next few days ahead of the US presidential election, analysts say, an event that will be key to determining whether and how the crypto class will be regulated in the years to come. A continuation of the recent BTC rally in the short term largely hinges on the election outcome, with traders increasingly convinced that a win from former President Donald Trump would lead to more favorable crypto regulation.
Bitcoin’s rise and fall: What drove performance this week?
After retesting and bouncing off a crucial support level last week, Bitcoin bulls regained control this week, with BTC rising 2.85% on Monday. This upward momentum was reflected in the continued increase in institutional demand through the US Bitcoin spot ETFs, which kept pace as the week went by.
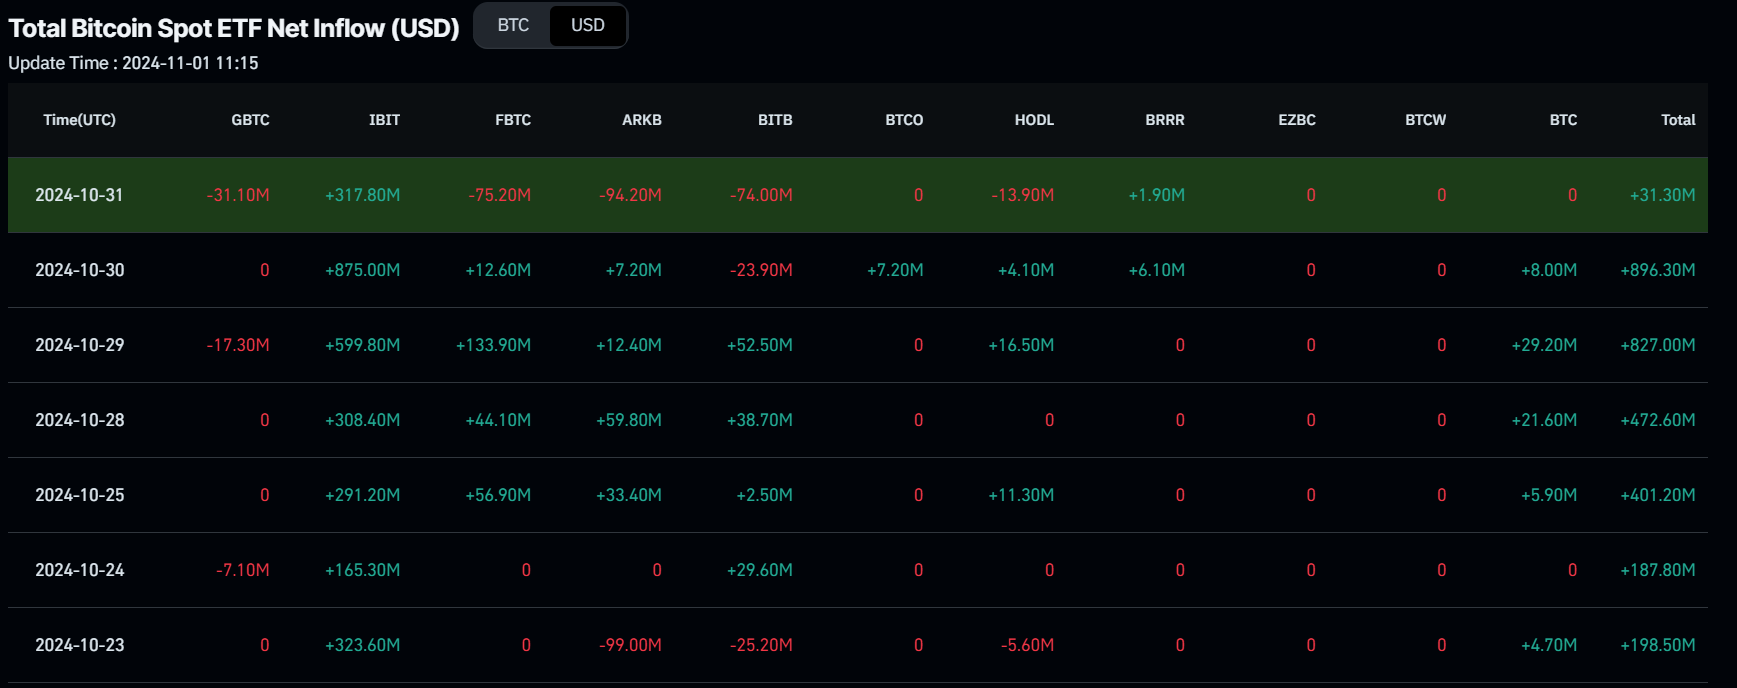
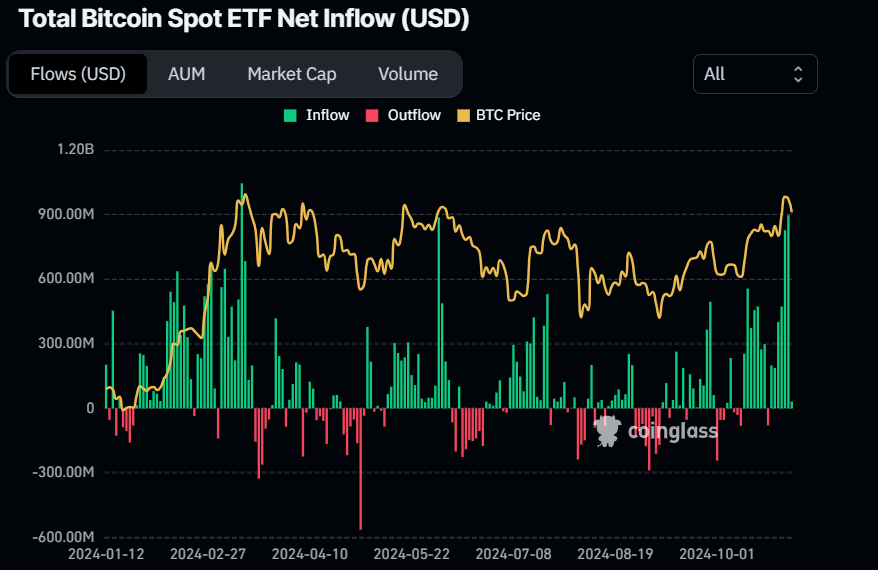
Total Bitcoin Spot ETF Net Inflow chart. Source: Coinglass
On Tuesday, Bitcoin continued its rally, rising 3.97% to reach a high of $73,620, approaching its all-time high of $73,777 from mid-March. This bullish momentum was bolstered by futures Open Interest (OI) at exchanges hit a new all-time high of $42.23 billion, according to CoinGlass data, indicating that new capital is entering the market and fueling fresh buying activity.
US spot ETFs saw another hefty gain of $827 million on Tuesday, the third largest single-day inflow since their launch in January.
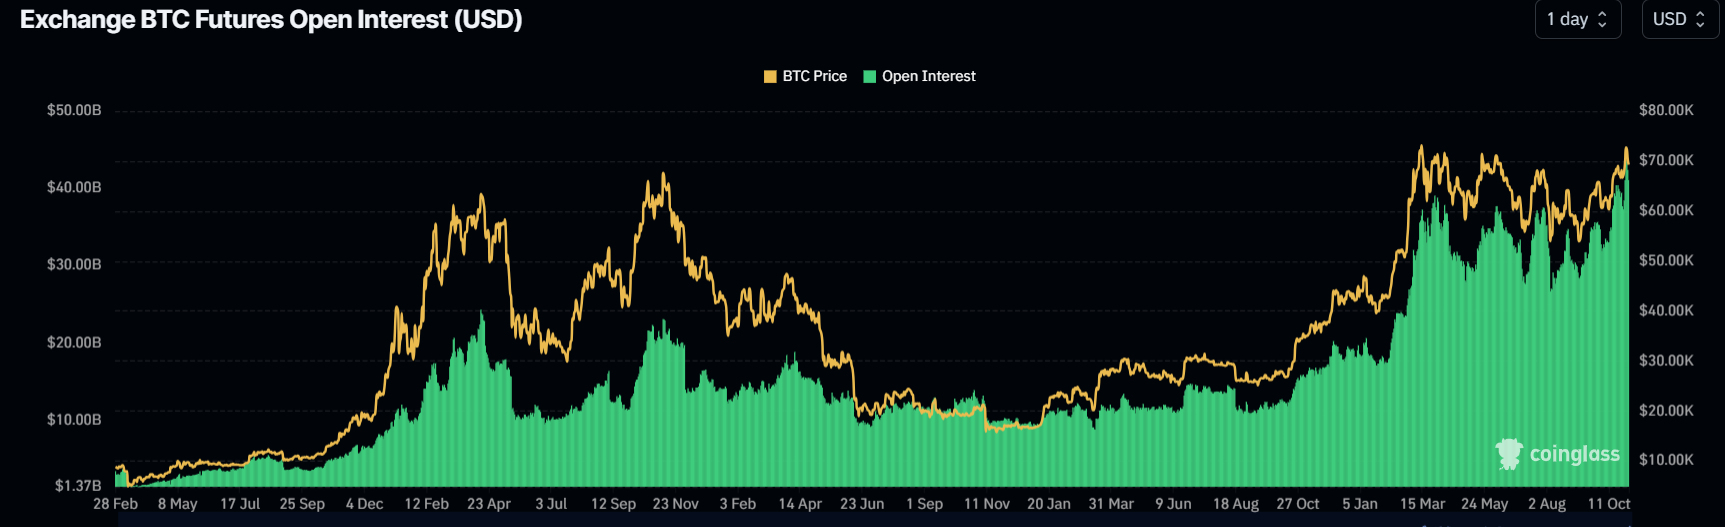
Bitcoin Futures Open Interest chart. Source: Coinglass
With BTC almost reaching new highs, some signs of profit taking emerged from both big and small players.
According to Arkham Intelligence, crypto wallets belonging to the Government of Bhutan transferred $66.55 million in BTC to Binance. This move suggests a potential strategy to leverage their mined Bitcoin for broader fiscal or operational plans in light of recent halving pressures and fluctuating mining outputs. If Bhutan decides to sell this BTC on exchanges, it could create selling pressure and lead to a decline in Bitcoin prices, given that the country currently holds $889.36 million in Bitcoin.
$
— Arkham (@ArkhamIntel) October 29, 2024
Crypto wallets belonging to the Royal Government of Bhutan moved $66.55M BTC to Binance this morning. The last time they deposited to exchanges was 4 months ago, at the start of July.
The Royal Government of… pic.twitter.com/9VKamwnACZ
Additionally, Santiment’s Network Realized Profit/Loss (NPL) indicator showed a positive spike on Tuesday, rising from 590.2 million to 1.39 billion in a day. This spike indicates that the holders were, on average, taking profits, a move that could also increase the selling pressure.
 [13.24.11, 01 Nov, 2024]-638660569209112687.png)
Bitcoin Network Realized Profit/Loss chart. Source: Santiment
From Wednesday to Thursday, Bitcoin fell 3.36%, reaching a low of $69,695, even as US spot Bitcoin ETFs kept registering robust inflows, posting over $2.22 billion in inflows until Thursday.
Some market watchers have attributed the crypto slump to declining odds of a victory by crypto-friendly candidate Donald Trump. On Polymarket, Trump’s chances of winning dropped to 61% from 67% just 48 hours earlier, while the odds for Democrat Kamala Harris surged from 33% to 39%.
“There is a risk of pre-election position unwinding, meaning that we are more likely to be lower than $73,000 than higher, come election day,” Kendrick wrote in a Thursday note.
He said Bitcoin prices would move more significantly if the Republicans win a majority in the US Congress, adding that this could see the digital asset reach $125,000 by year-end and spark a renewed altcoin season. “We think a Republican sweep would be especially helpful to Solana in this regard,” Kendrick added.
On Friday, Bitcoin continues its decline and trades slightly down around $69,500.
Lookonchain data on Friday shows that the defunct exchange Mt.Gox wallet transferred 500 BTC, valued at $35.04 million. Traders should remain cautious over the move as this transfer could be sent to exchanges like Bitstamp, BitGo, and Kraken for repayment to creditors.
The #MtGox wallet transferred 500 $BTC($35.04M) out 2 hours ago and currently holds 44,905 $BTC($3.11B).https://t.co/f2q66eQNuk pic.twitter.com/aDGMhSnuML
— Lookonchain (@lookonchain) November 1, 2024
If these funds are sold, it could generate fear, uncertainty, and doubt (FUD) among traders, potentially contributing to a decline in Bitcoin’s price. The wallet currently holds 44,905 BTC worth $3.11 billion.
Bitcoin technical outlook: New ATH at $78,955 hinges on US election outcome
Bitcoin’s weekly chart shows that the biggest crypto asset by market capitalization broke and successfully retested the breakout level of the downward-sloping parallel channel pattern around $65,800 last week. This week, it gained over 2%, reaching a high of $73,620 and later retreating to around $69,400.
If BTC continues to rally, the pattern’s technical target (obtained by measuring the distance between the two trendlines and extrapolating it higher) projects a new ATH of $78,955.
The Relative Strength Index (RSI) momentum indicator on the weekly chart trades at 59, above its neutral level of 50 and still far below overbought conditions, suggesting bullish momentum is gaining traction.
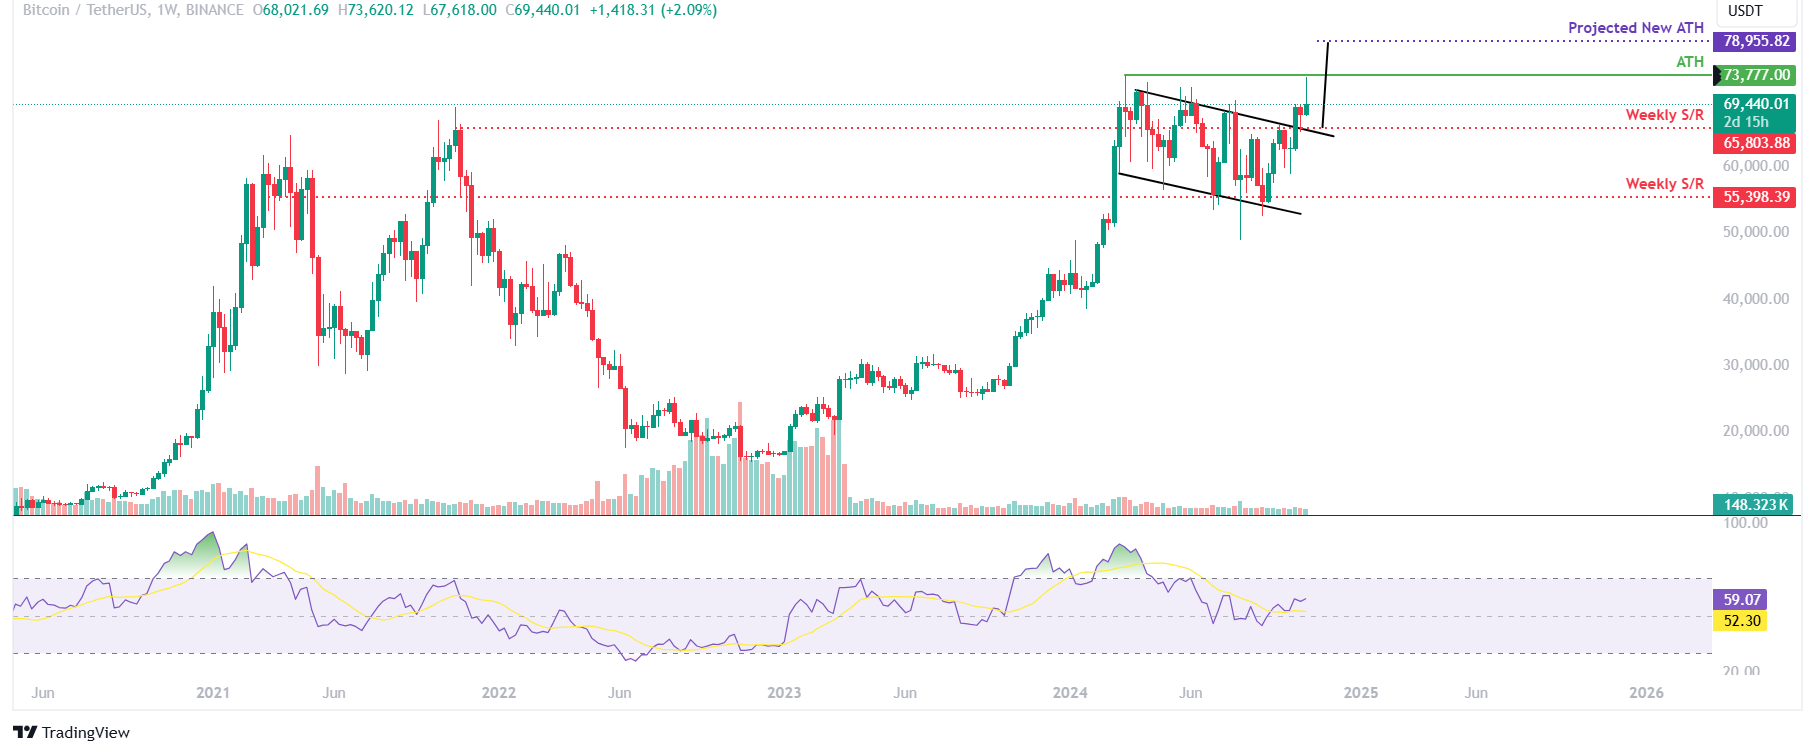
BTC/USDT weekly chart
The daily chart, however, shows signs of bull exhaustion as Bitcoin continues to decline on Friday.
If BTC continues to decline and closes below the $69,500 level, it could extend its drop by over 5% to retest the next key support level at $66,000, which closely aligns with the breakout level of the downward-sloping parallel channel pattern around $65,800 seen on the weekly chart.
The Relative Strength Index (RSI) on the daily chart, which peaked at an overbought level of 70 on Tuesday, has since dropped sharply to 57, signaling a significant weakening in bullish momentum and giving a sell signal by exiting overbought territory.
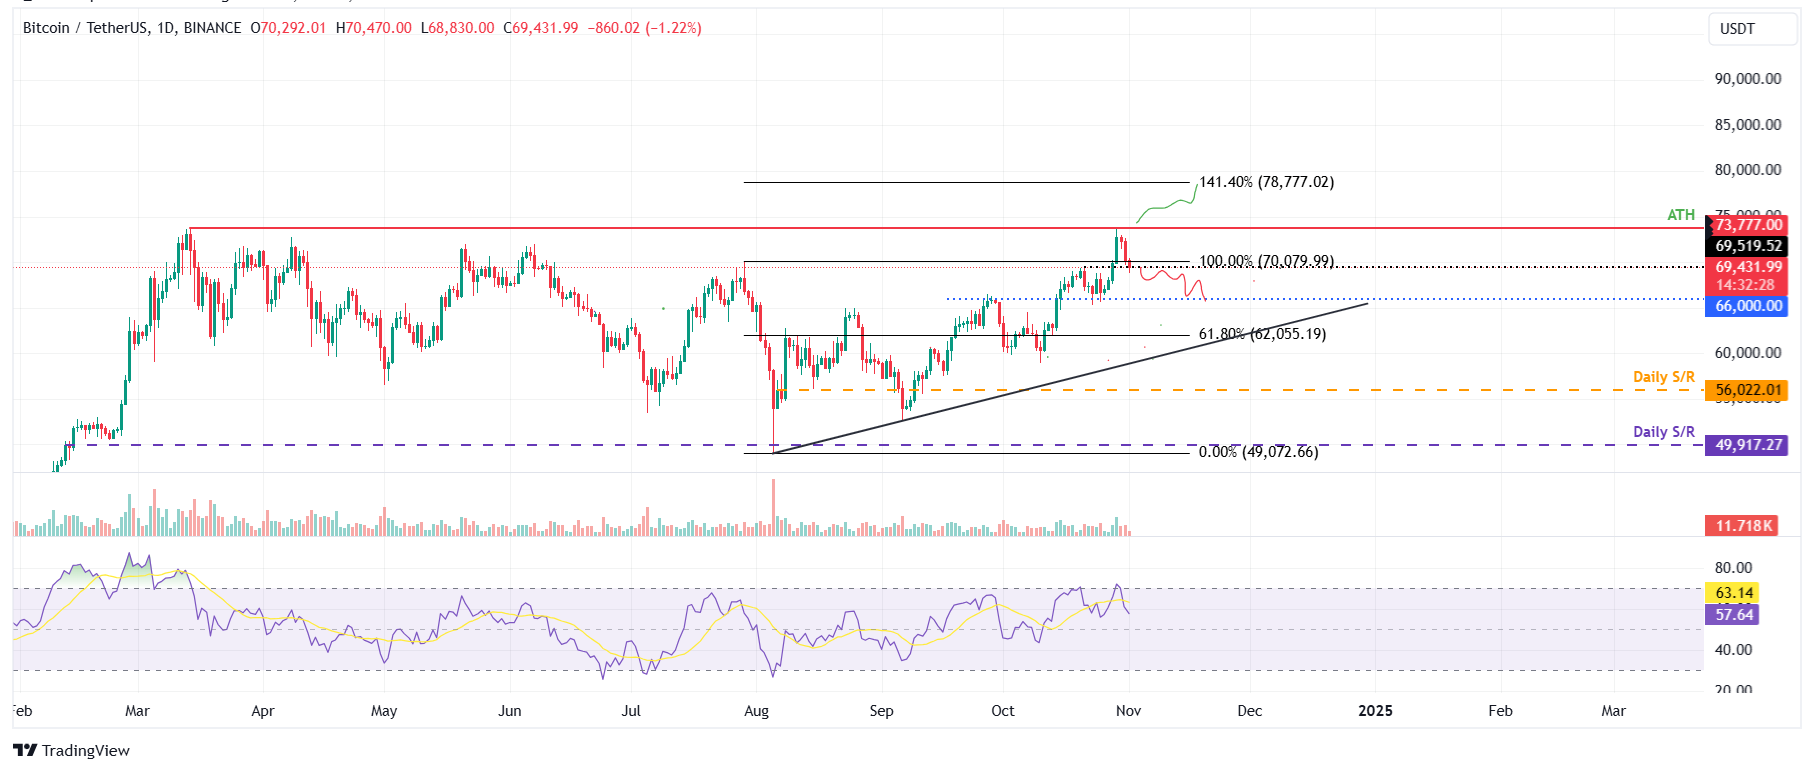
BTC/USDT daily chart
However, if Bitcoin holds above the $69,500 level, it may reattempt to retest and break through its all-time high of $73,777.
Despite the technical outlook described above, Bitcoin’s short-term price outlook will largely depend on the US presidential election outcome. The bullish momentum seems to be mainly fueled by a potential Donald Trump win, which could lead to more favorable crypto regulations. Polls are tight and any swings in the results might bring volatility in crypto markets.
Bitcoin, altcoins, stablecoins FAQs
Bitcoin is the largest cryptocurrency by market capitalization, a virtual currency designed to serve as money. This form of payment cannot be controlled by any one person, group, or entity, which eliminates the need for third-party participation during financial transactions.
Altcoins are any cryptocurrency apart from Bitcoin, but some also regard Ethereum as a non-altcoin because it is from these two cryptocurrencies that forking happens. If this is true, then Litecoin is the first altcoin, forked from the Bitcoin protocol and, therefore, an “improved” version of it.
Stablecoins are cryptocurrencies designed to have a stable price, with their value backed by a reserve of the asset it represents. To achieve this, the value of any one stablecoin is pegged to a commodity or financial instrument, such as the US Dollar (USD), with its supply regulated by an algorithm or demand. The main goal of stablecoins is to provide an on/off-ramp for investors willing to trade and invest in cryptocurrencies. Stablecoins also allow investors to store value since cryptocurrencies, in general, are subject to volatility.
Bitcoin dominance is the ratio of Bitcoin's market capitalization to the total market capitalization of all cryptocurrencies combined. It provides a clear picture of Bitcoin’s interest among investors. A high BTC dominance typically happens before and during a bull run, in which investors resort to investing in relatively stable and high market capitalization cryptocurrency like Bitcoin. A drop in BTC dominance usually means that investors are moving their capital and/or profits to altcoins in a quest for higher returns, which usually triggers an explosion of altcoin rallies.
추천 기사


