


Ethereum Price Forecast: ETH declines below $2,500 as demand fades
Ethereum price today:$2,490
- Ethereum price is nearing its daily support level of $2,461; a firm close below this level would suggest a decline ahead.
- Coinbase Premium Index shows signs of weakness and remains below neutral levels.
- ETH's long-to-short ratio is below one, the lowest level in one month, indicating that more traders are betting for prices to fall.
Ethereum (ETH) is trading in the red on Friday, nearing its daily support level of $2,461; a close below this level could signal further declines. This bearish outlook is further supported by the Coinbase Premium Index being below neutral and a long-to-short ratio under one, indicating falling demand, and more traders anticipating falling prices.
Ethereum institution demand wanes
CryptoQuant’s Ethereum Coinbase Premium Index shows signs of weakness and remains below neutral levels. This indicator measures the price gap between Coinbase Pro (USD pair) and Binance (USDT pair), and it serves as a key metric for assessing the behavior of large-wallet investors as it reflects whale accumulation trends. This is significant because Coinbase Pro is a primary gateway for institutional cryptocurrency purchases.
In the case of Ethereum, the metric currently stands at -0.072, below its neutral level of zero. It has been constantly declining since early October. If this downward trend persists or increases, it could increase selling pressure for Ethereum.
-638654330986710933.png)
Ethereum Coinbase Premium Index chart. Source: CryptoQuant
Additionally, Coinglass’s data shows that ETH's long-to-short ratio is 0.84. This ratio reflects bearish sentiment in the market, as the figure below one suggests that more traders anticipate the price of the coin to fall.
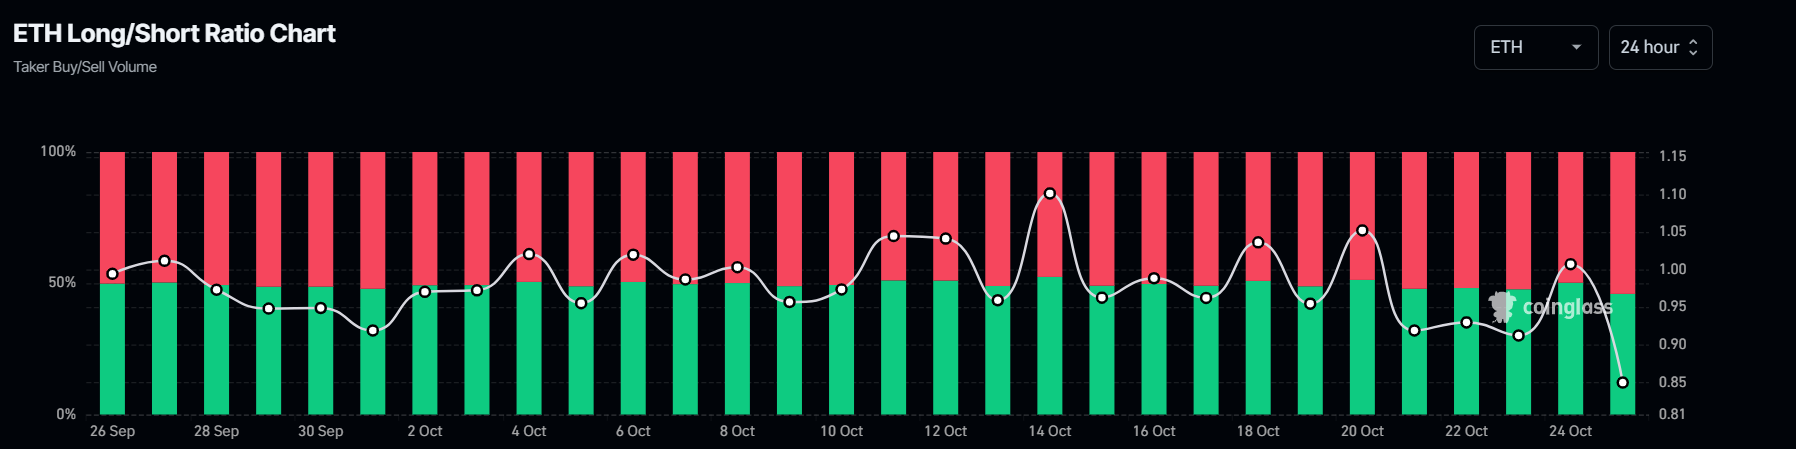
ETH long-to-short ratio chart. Source: Coinglass
Ethereum Price Forecast: Approaches critical support level
Ethereum price is nearing its daily support at $2,461 on Friday after facing rejection near a descending trendline (drawn by joining multiple highs from the end of May) earlier in the week and declining over 7.6% until Thursday.
If ETH breaks and closes below the $2,461 support level, it could decline over 12% to retest its September 6 low of $2,149.
The Relative Strength Index (RSI) indicator on the daily chart has declined to 45, below its neutral level of 50, indicating increasing bearish momentum.
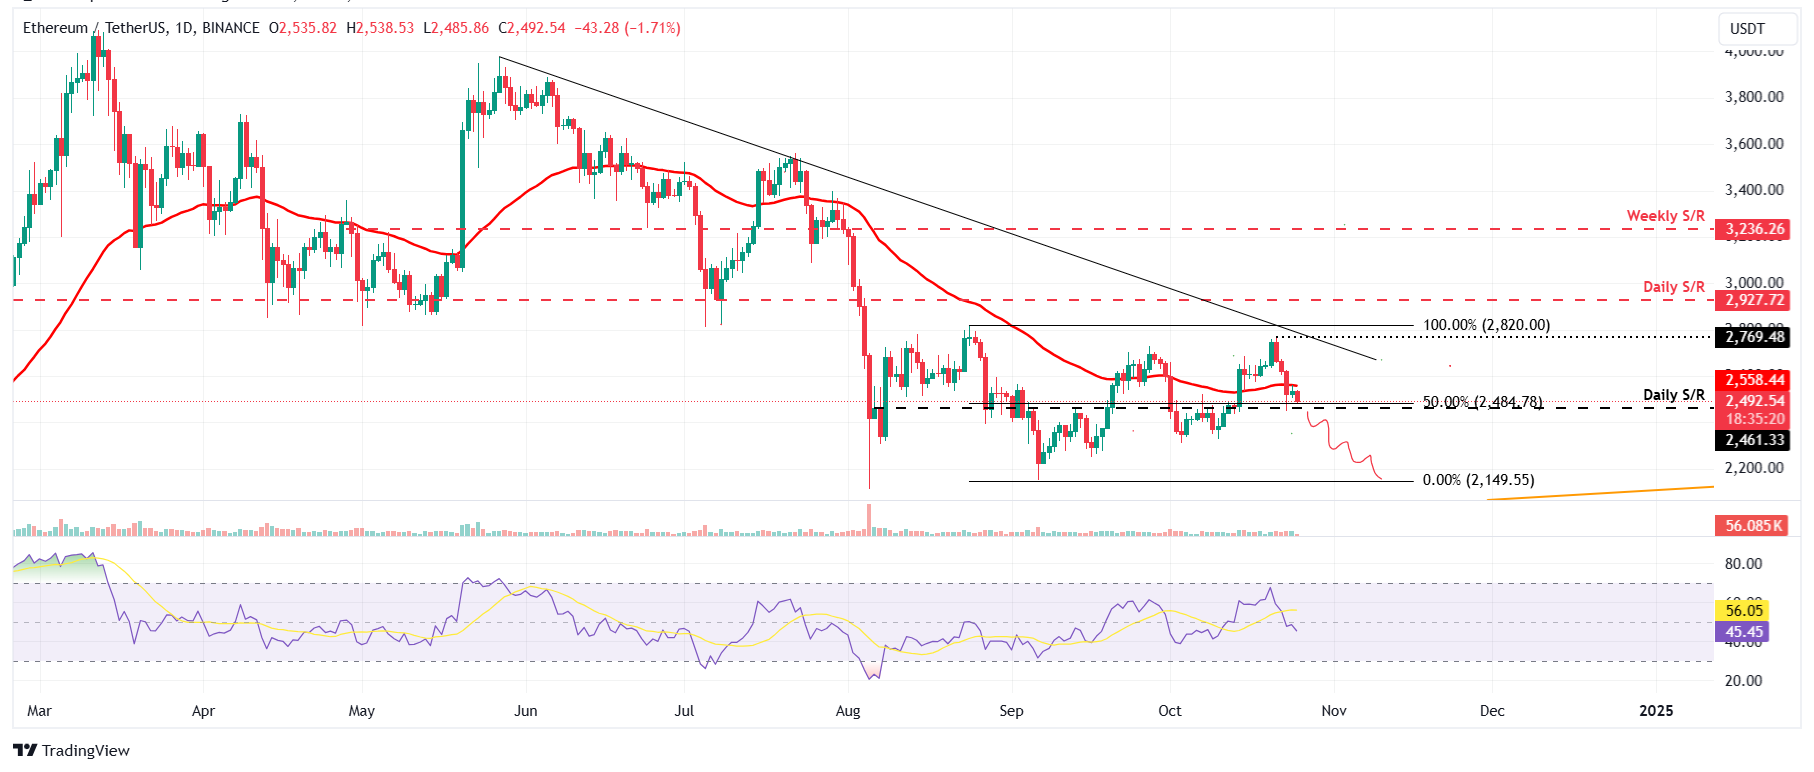
ETH/USDT daily chart
Conversely, if ETH finds support around the $2,461 support level and closes above the 50-day Exponential Moving Average (EMA) at $2,560, it could rally to retest its Monday high of $2,769.
Ethereum FAQs
Ethereum is a decentralized open-source blockchain with smart contracts functionality. Its native currency Ether (ETH), is the second-largest cryptocurrency and number one altcoin by market capitalization. The Ethereum network is tailored for building crypto solutions like decentralized finance (DeFi), GameFi, non-fungible tokens (NFTs), decentralized autonomous organizations (DAOs), etc.
Ethereum is a public decentralized blockchain technology, where developers can build and deploy applications that function without the need for a central authority. To make this easier, the network leverages the Solidity programming language and Ethereum virtual machine which helps developers create and launch applications with smart contract functionality.
Smart contracts are publicly verifiable codes that automates agreements between two or more parties. Basically, these codes self-execute encoded actions when predetermined conditions are met.
Staking is a process of earning yield on your idle crypto assets by locking them in a crypto protocol for a specified duration as a means of contributing to its security. Ethereum transitioned from a Proof-of-Work (PoW) to a Proof-of-Stake (PoS) consensus mechanism on September 15, 2022, in an event christened “The Merge.” The Merge was a key part of Ethereum's roadmap to achieve high-level scalability, decentralization and security while remaining sustainable. Unlike PoW, which requires the use of expensive hardware, PoS reduces the barrier of entry for validators by leveraging the use of crypto tokens as the core foundation of its consensus process.
Gas is the unit for measuring transaction fees that users pay for conducting transactions on Ethereum. During periods of network congestion, gas can be extremely high, causing validators to prioritize transactions based on their fees.
추천 기사


