

Bitcoin Weekly Forecast: $70,000 mark on sight as bulls remain strong
- Bitcoin is poised for a third consecutive week of gains, breaking above its range upper limit of $64,700.
- US spot Bitcoin ETFs posted $612.60 million in inflows until Thursday, indicating a rise in institutional demand.
- Investors should be cautious about the activity in dormant wallets and Mt. Gox-related addresses.
Bitcoin (BTC) has risen around 3% so far this week, breaking above its range upper limit of $64,700. This gain was supported by increased institutional demand for ETFs, which recorded inflows of more than $612 million this week. While some analysts suggest that the macroeconomic backdrop could bolster risk assets like Bitcoin, others point to an ongoing consolidation. From a technical point of view, bulls seem to be having the upper hand, looking at the next critical resistance around $70,000.
Bitcoin sees rise in institutional demand
Institutional flows supported Bitcoin’s price this week. According to Coinglass data, US spot Bitcoin ETFs experienced four straight days of inflows until Thursday totaling $612.60 million. The total Bitcoin reserves held by the 11 US spot Bitcoin ETFs rose from $50.53 billion to $51.15 billion, the highest level since the end of July.
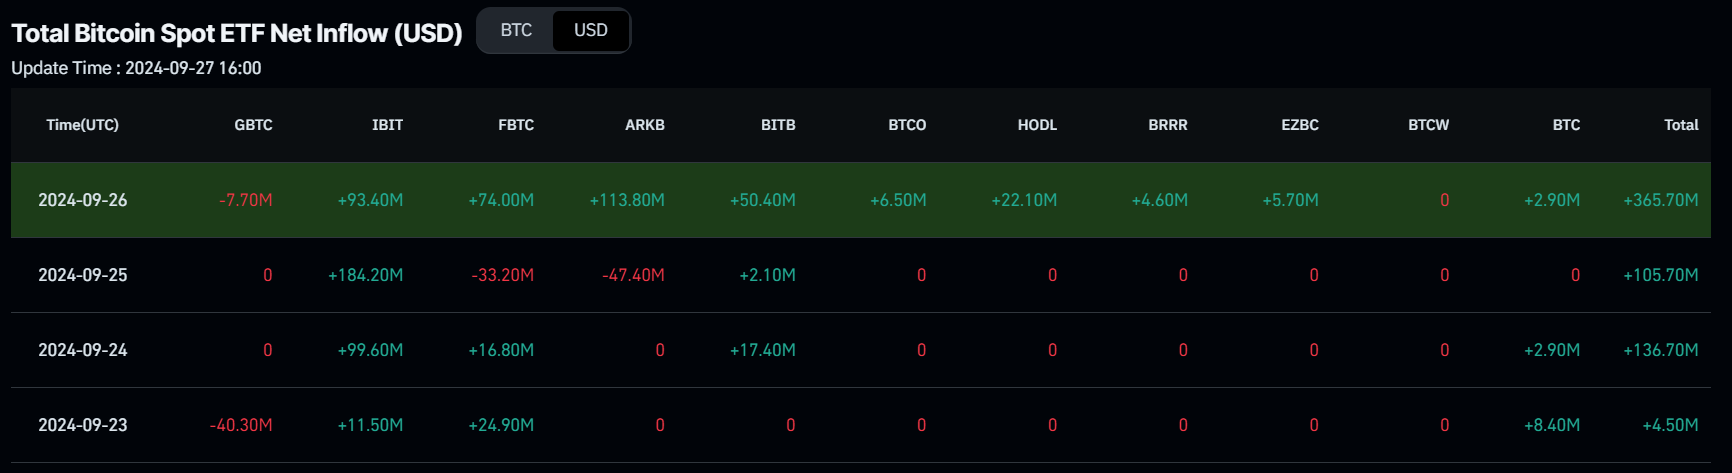
Bitcoin Spot ETF Net Inflow chart
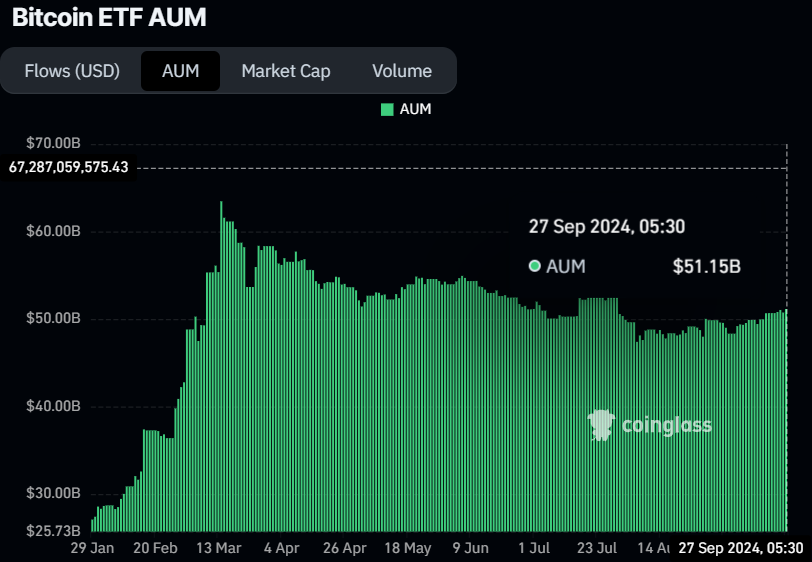
Bitcoin ETF AUM chart
Global macro to support Bitcoin
QCP Capital’s report this week highlights a series of macroeconomic developments that could be more bullish for risk assets, including crypto.
According to the report, “The People’s Bank of China (PBoC) introduced several policies aimed at kickstarting their sputtering housing market and anemic equity market. It has apparently worked (for now) as Chinese A50 futures closed 8% higher, with Chinese and Hong Kong indices following suit.”
The report also highlights the widened yield spread between the 2-year and 10-year US Treasury notes over the past month, which moved 40bps higher and is now trading at 21bps. A widening spread generally suggests optimism about economic growth, which supports risk assets in the medium to long term.
Additionally, on the US political front, Kamala Harris spoke positively about AI and digital assets at her fundraiser. Following her speech, rallies in AI-related coins were observed. The SEC approving options trading on IBIT (BlackRock’s Spot BTC ETF) also shows the growing acceptance and demand for digital assets as an asset class.
Active dormant wallet and Mt.Gox wallet activity raise concerns
Moves in dormant wallets and also in those related to the defunct crypto exchange Mt.Gox have raised some concerns among the crypto community.
According to data from Arkham’s intelligence, on Wednesday, Mt. Gox emptied four of their wallets after receiving $370,000 in BTC funds from the Kraken exchange. This move could be part of the repayments to the creditors coming soon. If these repayments proceed to the creditors, fear, uncertainty, and doubt (FUD) could spark among the traders, as these creditors’ are more likely to transfer their BTC into centralized exchanges to sell. Investors must be cautious about such activity. Mt.Gox wallet currently holds 44,899 BTC worth $2.85 billion.
The data also shows that a 13-year-old whale wallet, which had remained inactive since mid-2011, transferred 20 BTC valued at $1.27 million to the Bitstamp exchange on Tuesday, marking its first movement since the coins were initially received. During the same period, another whale wallet holding $77 million worth of BTC also move five BTC to Kraken. This wallet still holds 1,215 BTC worth $77 million and has been mining since 2009, one month after the Bitcoin launch. This whale woke up around three weeks ago and has moved 10 Bitcoins to Kraken in three separate transactions.
The third early Bitcoin whale, which mined Bitcoin around the same time, was active last week after 15 years of dormancy to move $16 million worth of BTC.
Investors must be cautious about such activity. The movement of BTC by early dormant wallets could also create FUD, as the wallets generally move BTC into centralized exchanges to sell their holdings.
ANOTHER ANCIENT BITCOIN WHALE MOVES $3M BTC
— Arkham (@ArkhamIntel) September 24, 2024
A 13 year old whale with $3.17M BTC from mid-2011 woke up today.
This wallet has not made a single move since receiving the coins 13 years ago.
They have just transferred 20 BTC ($1.27M) to Bitstamp. https://t.co/hQe43GgYtm pic.twitter.com/HnvbZbgDHK
On-chain metrics signal consolidation
Glassnode’s weekly report published on Friday explains how the current crypto market structure is very similar to the 2019-2020 period, when the market experienced an extended consolidation range after a strong rally in the second quarter of 2019.
The report measures the z-score of two gradients (155-day price gradient against the realized price). The chart below explains that negative values can be interpreted as periods of relatively weak demand, resulting in a sustained price contraction.
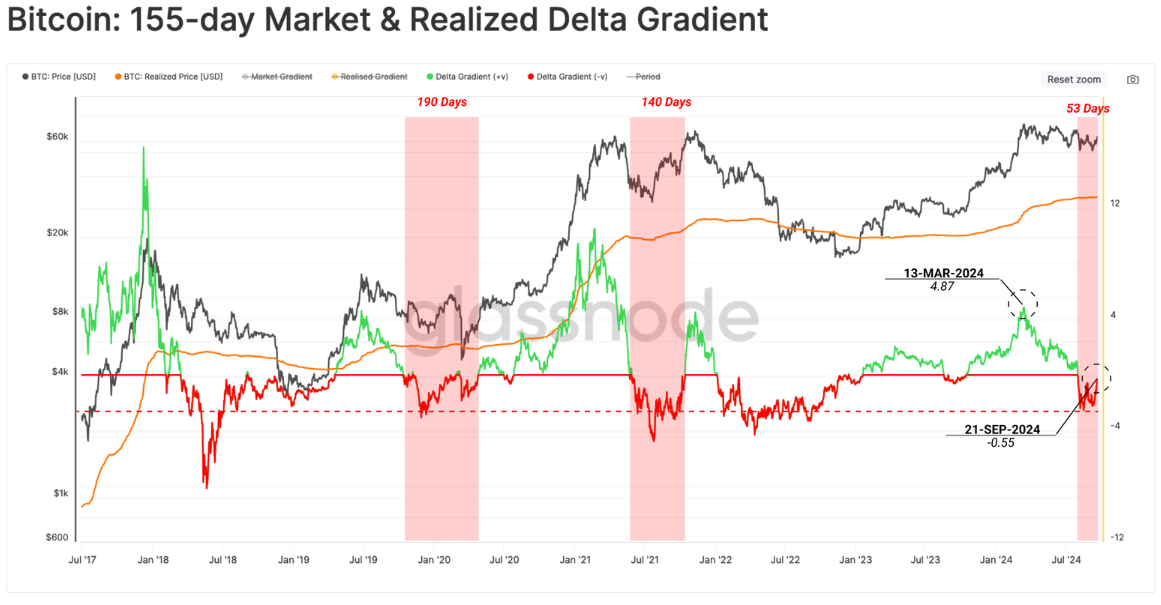
Bitcoin 155-day Market & Realized Delta Gradient chart
The report further explains that capital inflow into the Bitcoin network slowed down after the market reached the March all-time high (ATH), resulting in diminishing price momentum. The chart below compares the smoothed 155-day price gradient (black) against the realized price (orange).
The market gradient has fallen into negative values over recent weeks, while the realized price gradient is positive but trending lower. This indicates that the downside in the spot price was more aggressive than the intensity of capital outflows, suggesting consolidation in the Bitcoin price.
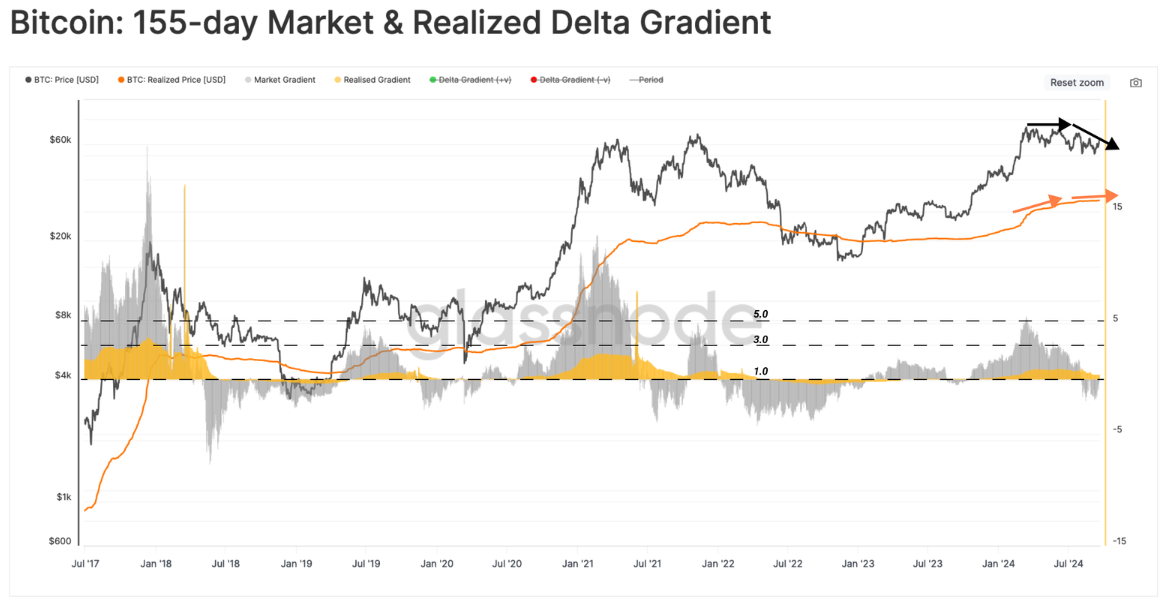
Bitcoin 155-day Market & Realized Delta Gradient chart
BTC on the road to $70,000
Bitcoin price broke and closed above its consolidation zone between $62,000 and $64,700 on Thursday, closing above $65,000. As of Friday, it is trading slightly higher, around $64,900, encountering resistance at the daily level of $65,379.
If BTC breaks and closes above its daily resistance level at $65,379, it could rally 7% from the breakout point to retest its July 29 high of $70,079.
The Relative Strength Index (RSI) on the daily chart has declined slightly but remains close to 65, well above the neutral level. For Bitcoin to continue its rally, the RSI must rise above its current trading level. However, traders should be cautious if it exceeds the overbought level at 70.
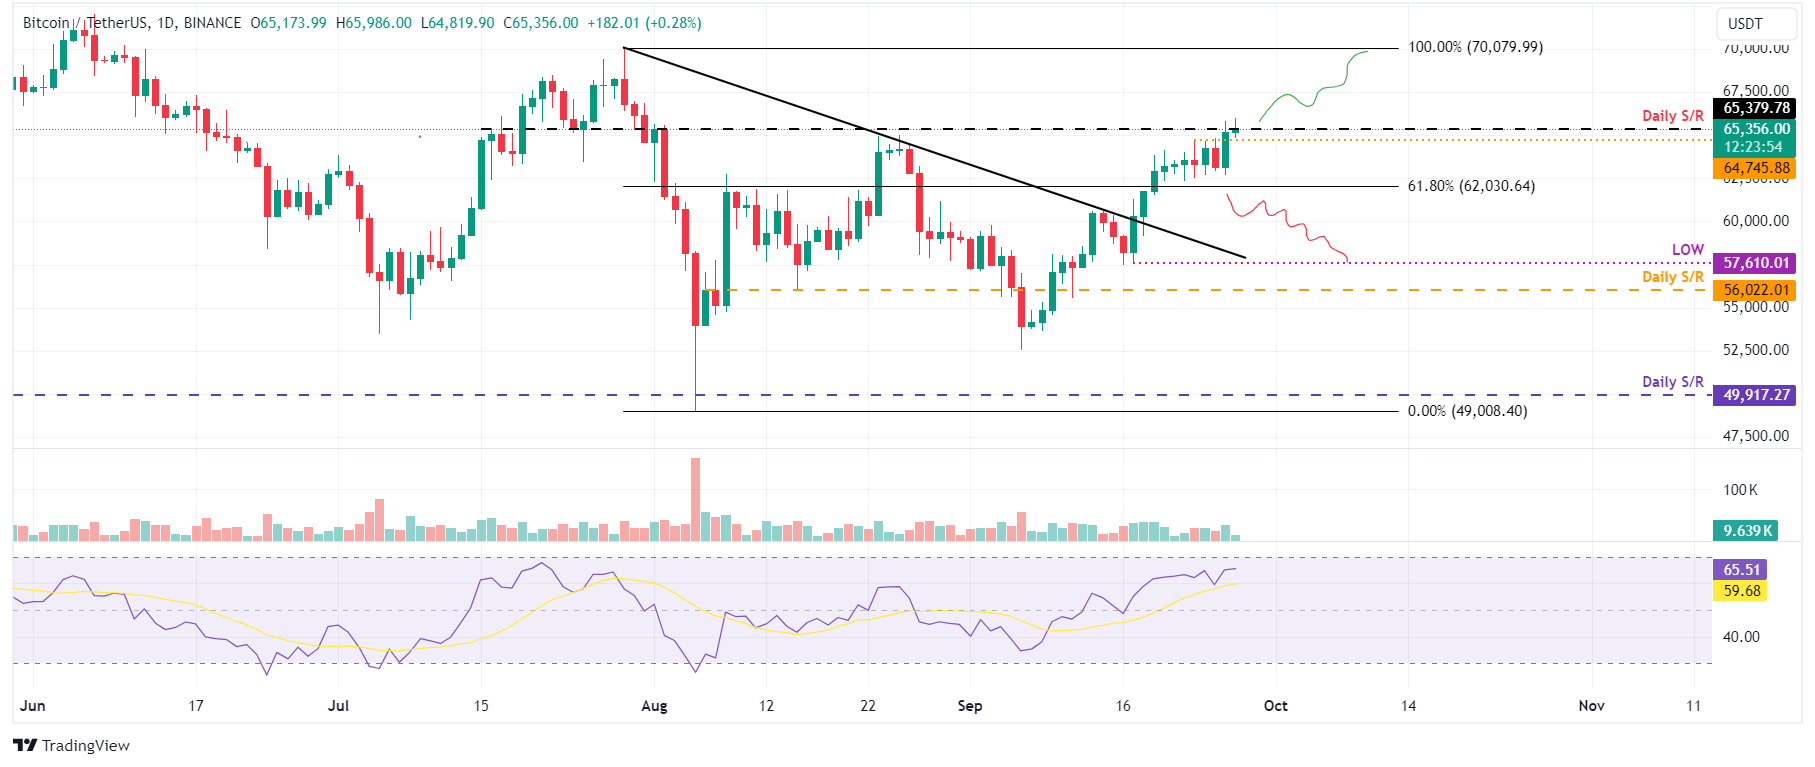
BTC/USDT daily chart
On the other hand, if BTC breaks and closes below the consolidation zone around $62,000, it could extend the decline by 7% to retest its September 17 low of $57,610.
Bitcoin, altcoins, stablecoins FAQs
Bitcoin is the largest cryptocurrency by market capitalization, a virtual currency designed to serve as money. This form of payment cannot be controlled by any one person, group, or entity, which eliminates the need for third-party participation during financial transactions.
Altcoins are any cryptocurrency apart from Bitcoin, but some also regard Ethereum as a non-altcoin because it is from these two cryptocurrencies that forking happens. If this is true, then Litecoin is the first altcoin, forked from the Bitcoin protocol and, therefore, an “improved” version of it.
Stablecoins are cryptocurrencies designed to have a stable price, with their value backed by a reserve of the asset it represents. To achieve this, the value of any one stablecoin is pegged to a commodity or financial instrument, such as the US Dollar (USD), with its supply regulated by an algorithm or demand. The main goal of stablecoins is to provide an on/off-ramp for investors willing to trade and invest in cryptocurrencies. Stablecoins also allow investors to store value since cryptocurrencies, in general, are subject to volatility.
Bitcoin dominance is the ratio of Bitcoin's market capitalization to the total market capitalization of all cryptocurrencies combined. It provides a clear picture of Bitcoin’s interest among investors. A high BTC dominance typically happens before and during a bull run, in which investors resort to investing in relatively stable and high market capitalization cryptocurrency like Bitcoin. A drop in BTC dominance usually means that investors are moving their capital and/or profits to altcoins in a quest for higher returns, which usually triggers an explosion of altcoin rallies.
추천 기사


