

Bitcoin price consolidates following cooldown from post-Fed rate cut rally
- Bitcoin price consolidates between the $62,000 and $64,700 key levels.
- Santiment’s Network Realized Profit/Loss (NPL) indicates that some BTC traders are booking profits.
- On-chain data shows mild EFT inflows and weakening spot buying pressure, pointing to a short-term consolidation.
Bitcoin (BTC) trades around $63,800 on Tuesday, consolidating within the $62,000 and $64,700 key levels. At the same time, on-chain data indicates short-term consolidation due to profit-taking by holders, mild spot BTC Exchange Traded Funds (ETF) inflows, and weakening spot buying pressure.
Bitcoin holders book some profit as institutional demand hints at a minor fall
On-chain data provider Santiment’s Network Realized Profit/Loss (NPL) indicates that some BTC traders are booking profits. The NPL metric shows a daily network-level Return On Investment (ROI) based on the coin’s on-chain transaction volume. Strong spikes in a coin’s NPL indicate that its holders are, on average, selling their bags at a significant profit. On the other hand, strong dips imply that the coin’s holders are, on average, realizing losses, suggesting panic sell-offs and investor capitulation.
In BTC’s case, the NPL indicator spiked from 553.43 million to 1.33 billion from September 19 to September 20 and from 120.79 million to 757.43 million from Sunday to Monday, respectively. This uptick indicates that the holders were, on average, realizing profits.
 [12.26.53, 24 Sep, 2024]-638627713220799247.png)
Bitcoin Network Realized Profit/Loss chart
CryptoQuant’s Bitcoin Coinbase Premium Index shows a minor decrease in institutional demand. This indicator shows how large-wallet investors behave or what the institutional demand is. The indicator shows the gap between the Coinbase Pro price (USD pair) and the Binance price (USDT pair). Coinbase Premium data is one of the indicators that shows a sign of whale accumulation, as the Coinbase Pro platform is considered the gateway for institutional investors to purchase cryptocurrencies.
In the case of Bitcoin, the index declined from 0.021 to -0.001 from Saturday to Monday, trading below its 14-day Simple Moving Average (SMA) of 0.014. This mild fall indicates that whales or institutional demand have fallen slightly, pointing to a short-term consolidation in Bitcoin’s price.
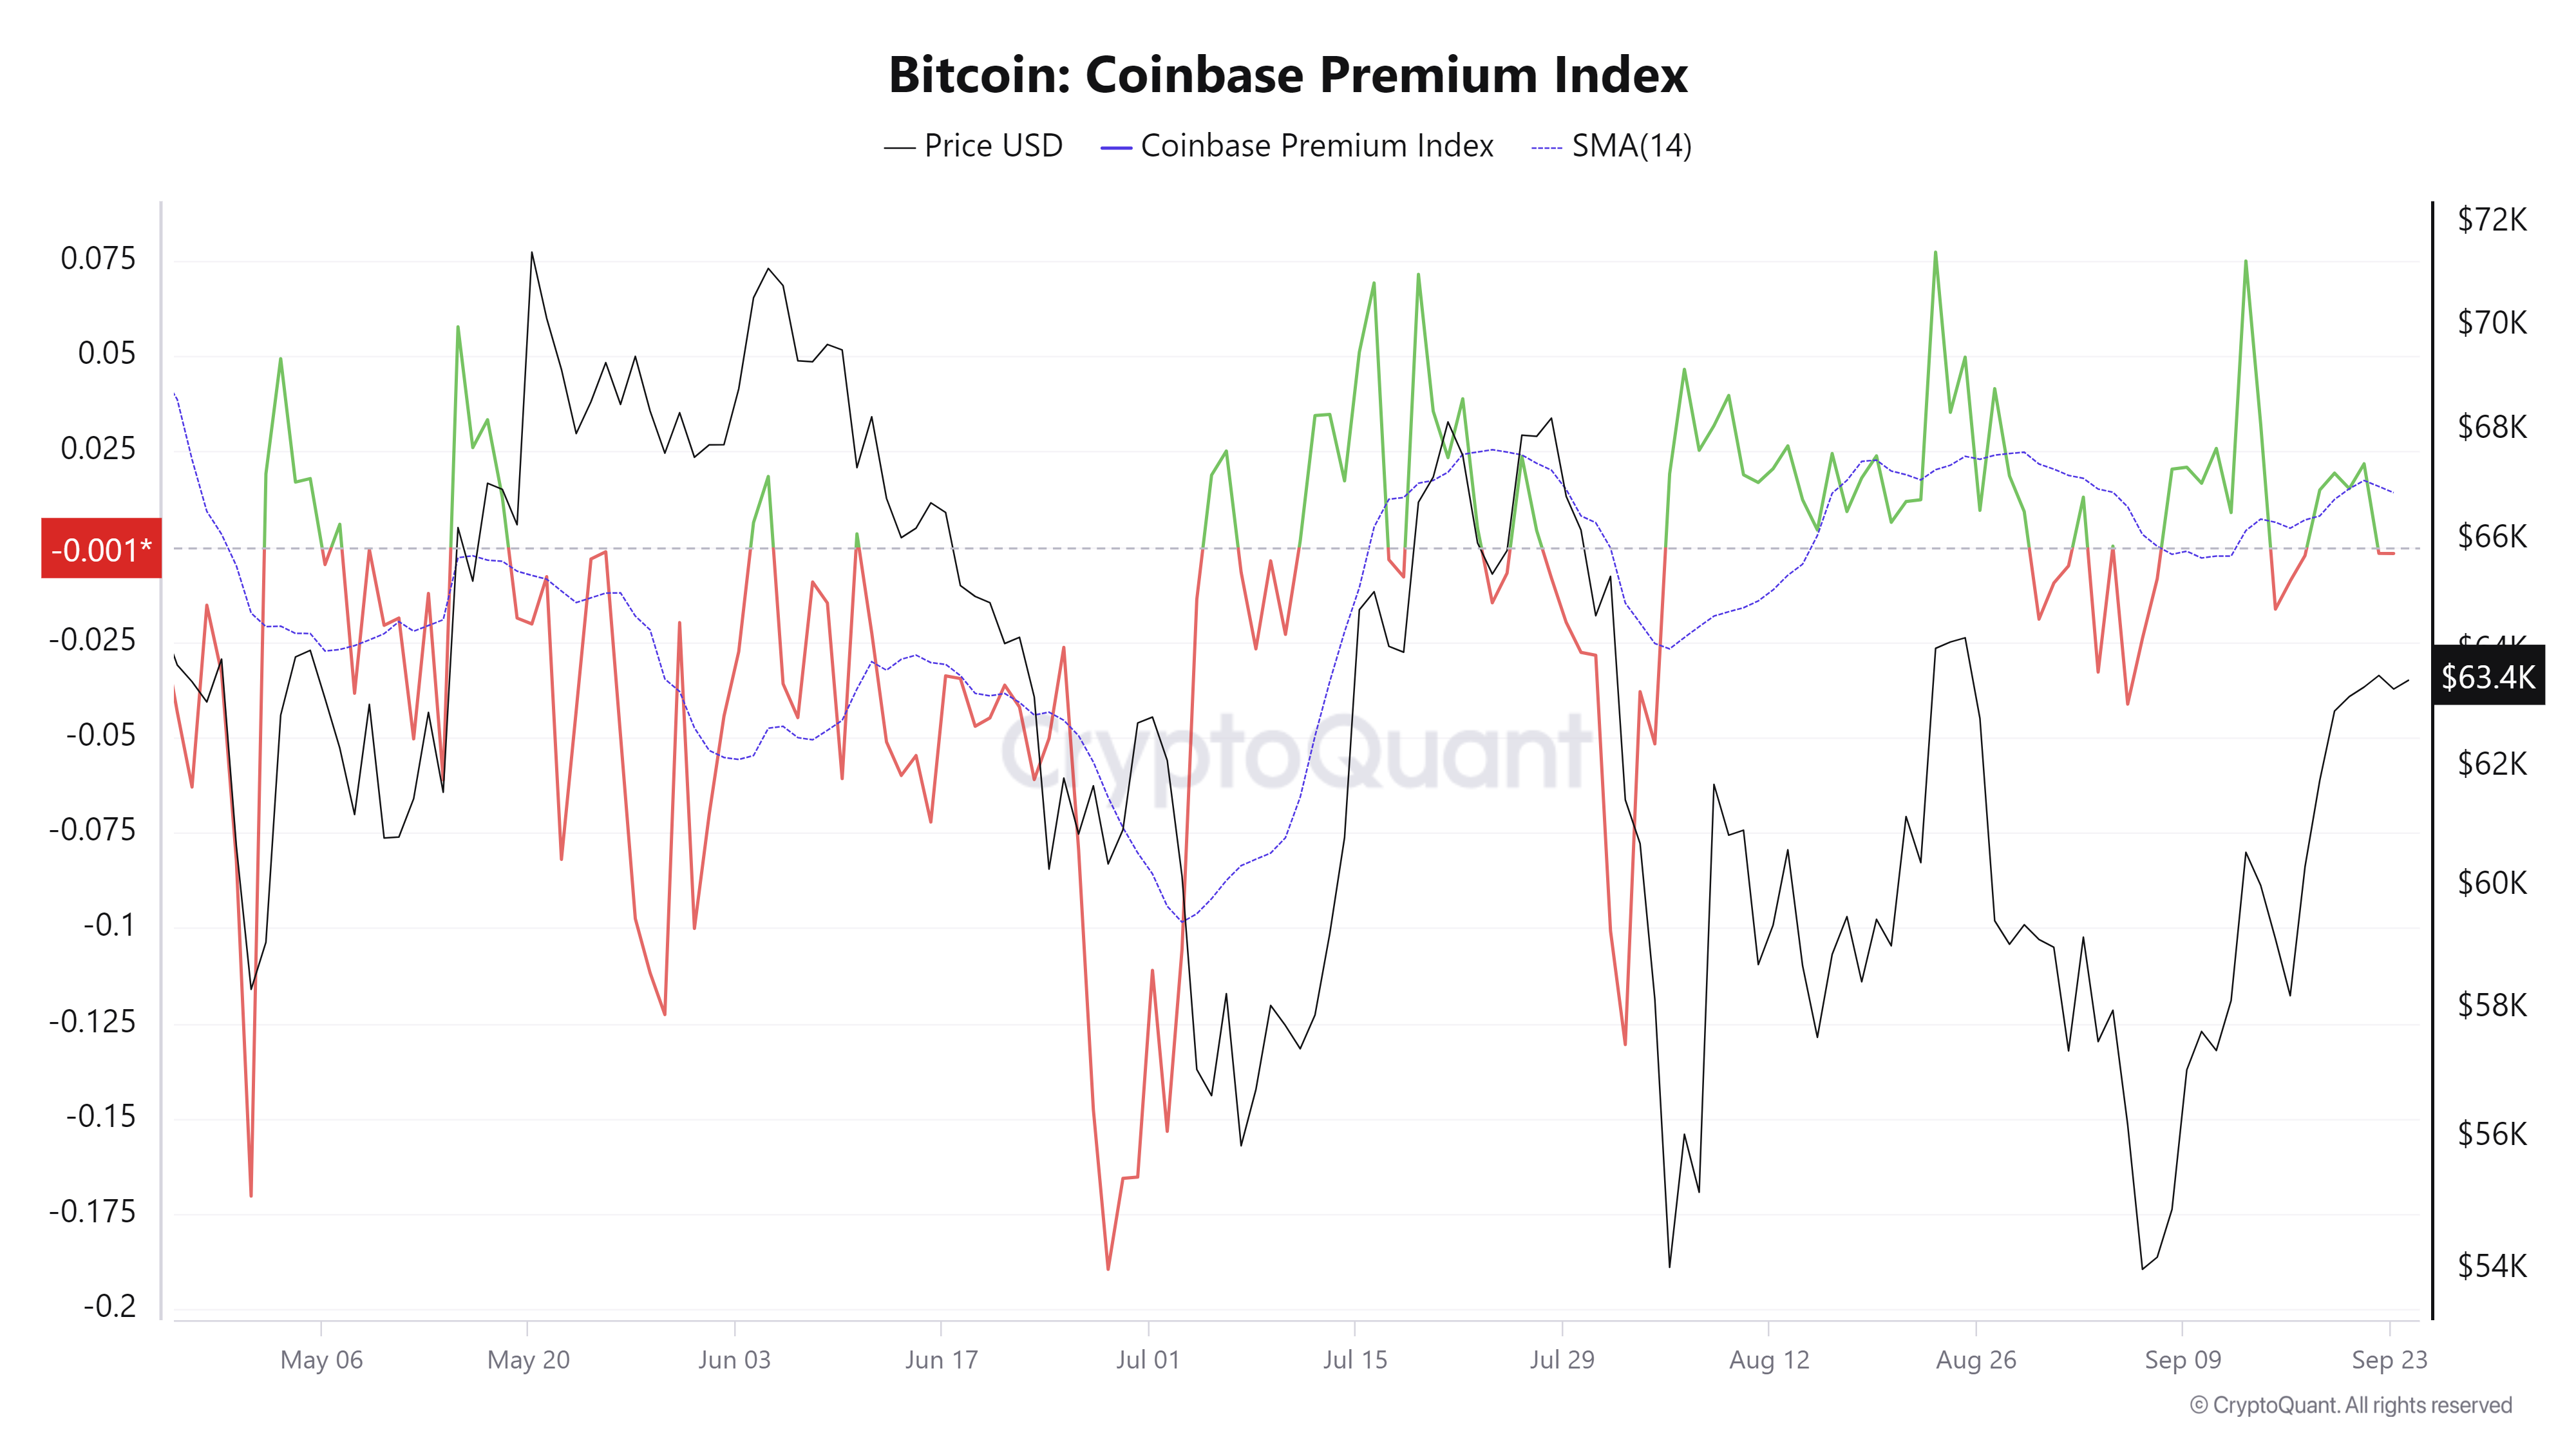
Bitcoin Coinbase Premium Index chart
Furthermore, Coinglass's Spot ETF data shows weakening spot market buying pressure. On Monday, the US spot Bitcoin ETF experienced mild inflows of $4.50 million. This small inflow suggests stagnant institutional demand, which hints at short-term consolidation in Bitcoin’s price.
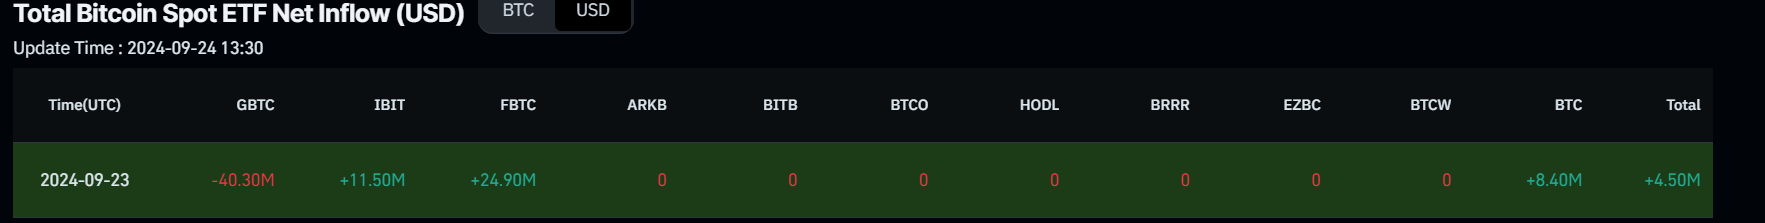
Bitcoin Spot ETF Net Inflow chart
Technical analysis: Bitcoin price consolidates between $62,000 and $64,700
Bitcoin price rallied 7.5% last week and has recently been consolidating between the $62,000 and $64,700 key levels. At the time of writing on Tuesday, it trades at around $63,800.
If Bitcoin’s price breaks above this consolidating range around $64,700, it could first rise to retest its daily resistance level at $65,379. A successful daily close above this level could extend the rally by 7% to retest its July 29 high of $70,079.
The Relative Strength Index (RSI) on the daily chart trades above its neutral level of 50 and points upwards, at 63. A cross to levels above 60 generally indicates bullish momentum is gaining traction. However, traders should be cautious as it approaches its overbought level at 70.
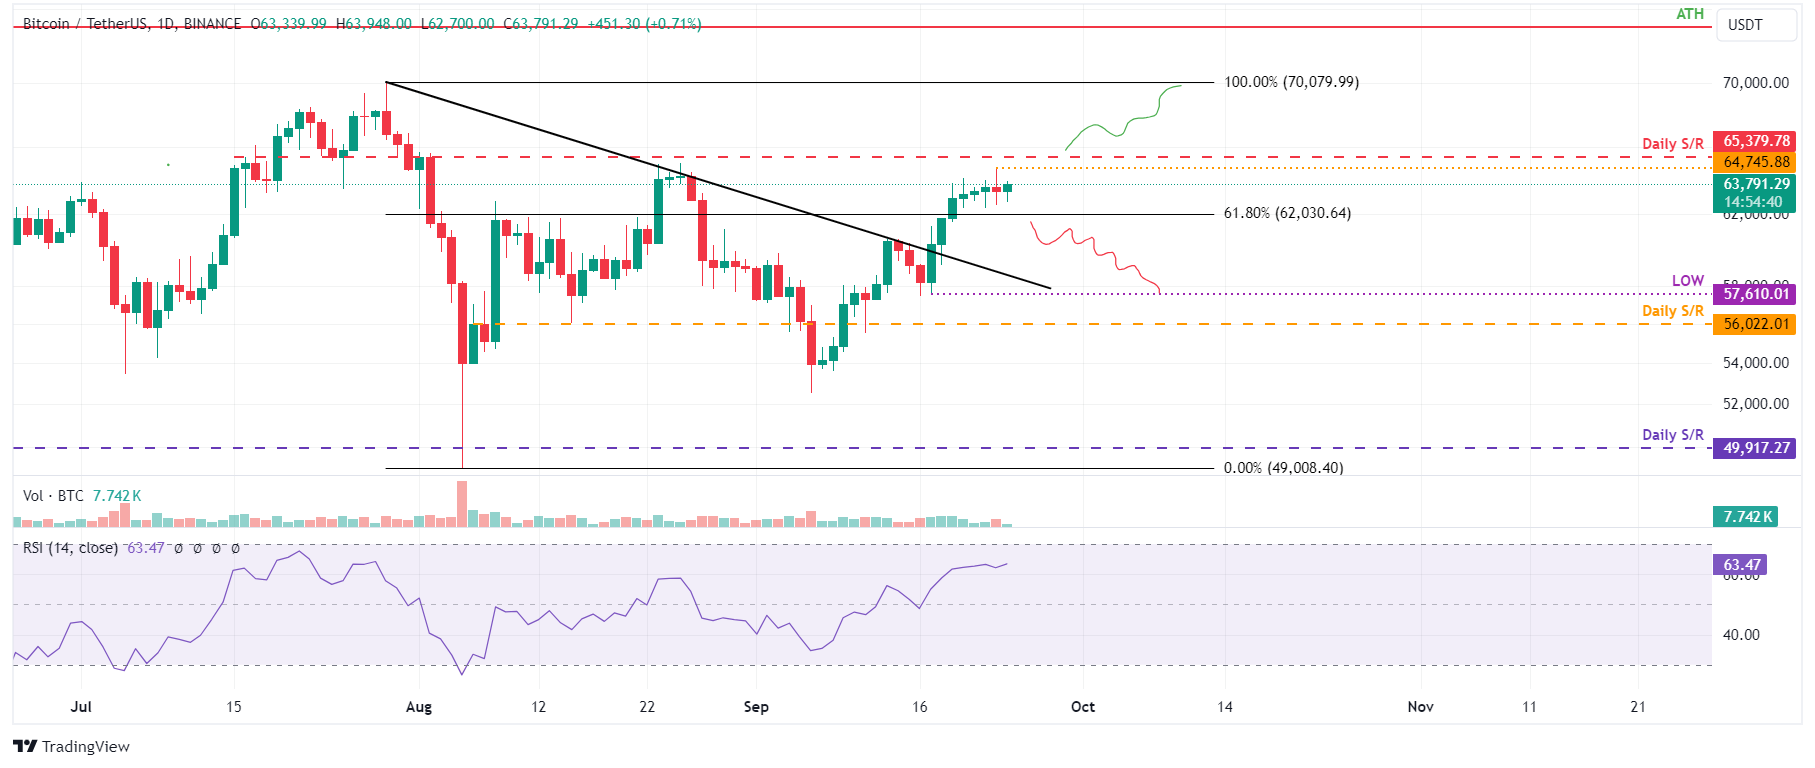
BTC/USDT daily chart
However, if BTC breaks and closes below the consolidation zone around $62,000, it could decline 7% to retest its September 17 low of $57,610.
Bitcoin, altcoins, stablecoins FAQs
Bitcoin is the largest cryptocurrency by market capitalization, a virtual currency designed to serve as money. This form of payment cannot be controlled by any one person, group, or entity, which eliminates the need for third-party participation during financial transactions.
Altcoins are any cryptocurrency apart from Bitcoin, but some also regard Ethereum as a non-altcoin because it is from these two cryptocurrencies that forking happens. If this is true, then Litecoin is the first altcoin, forked from the Bitcoin protocol and, therefore, an “improved” version of it.
Stablecoins are cryptocurrencies designed to have a stable price, with their value backed by a reserve of the asset it represents. To achieve this, the value of any one stablecoin is pegged to a commodity or financial instrument, such as the US Dollar (USD), with its supply regulated by an algorithm or demand. The main goal of stablecoins is to provide an on/off-ramp for investors willing to trade and invest in cryptocurrencies. Stablecoins also allow investors to store value since cryptocurrencies, in general, are subject to volatility.
Bitcoin dominance is the ratio of Bitcoin's market capitalization to the total market capitalization of all cryptocurrencies combined. It provides a clear picture of Bitcoin’s interest among investors. A high BTC dominance typically happens before and during a bull run, in which investors resort to investing in relatively stable and high market capitalization cryptocurrency like Bitcoin. A drop in BTC dominance usually means that investors are moving their capital and/or profits to altcoins in a quest for higher returns, which usually triggers an explosion of altcoin rallies.
추천 기사


