

Bitcoin rally to $65,000 likely if BTC crosses these hurdles
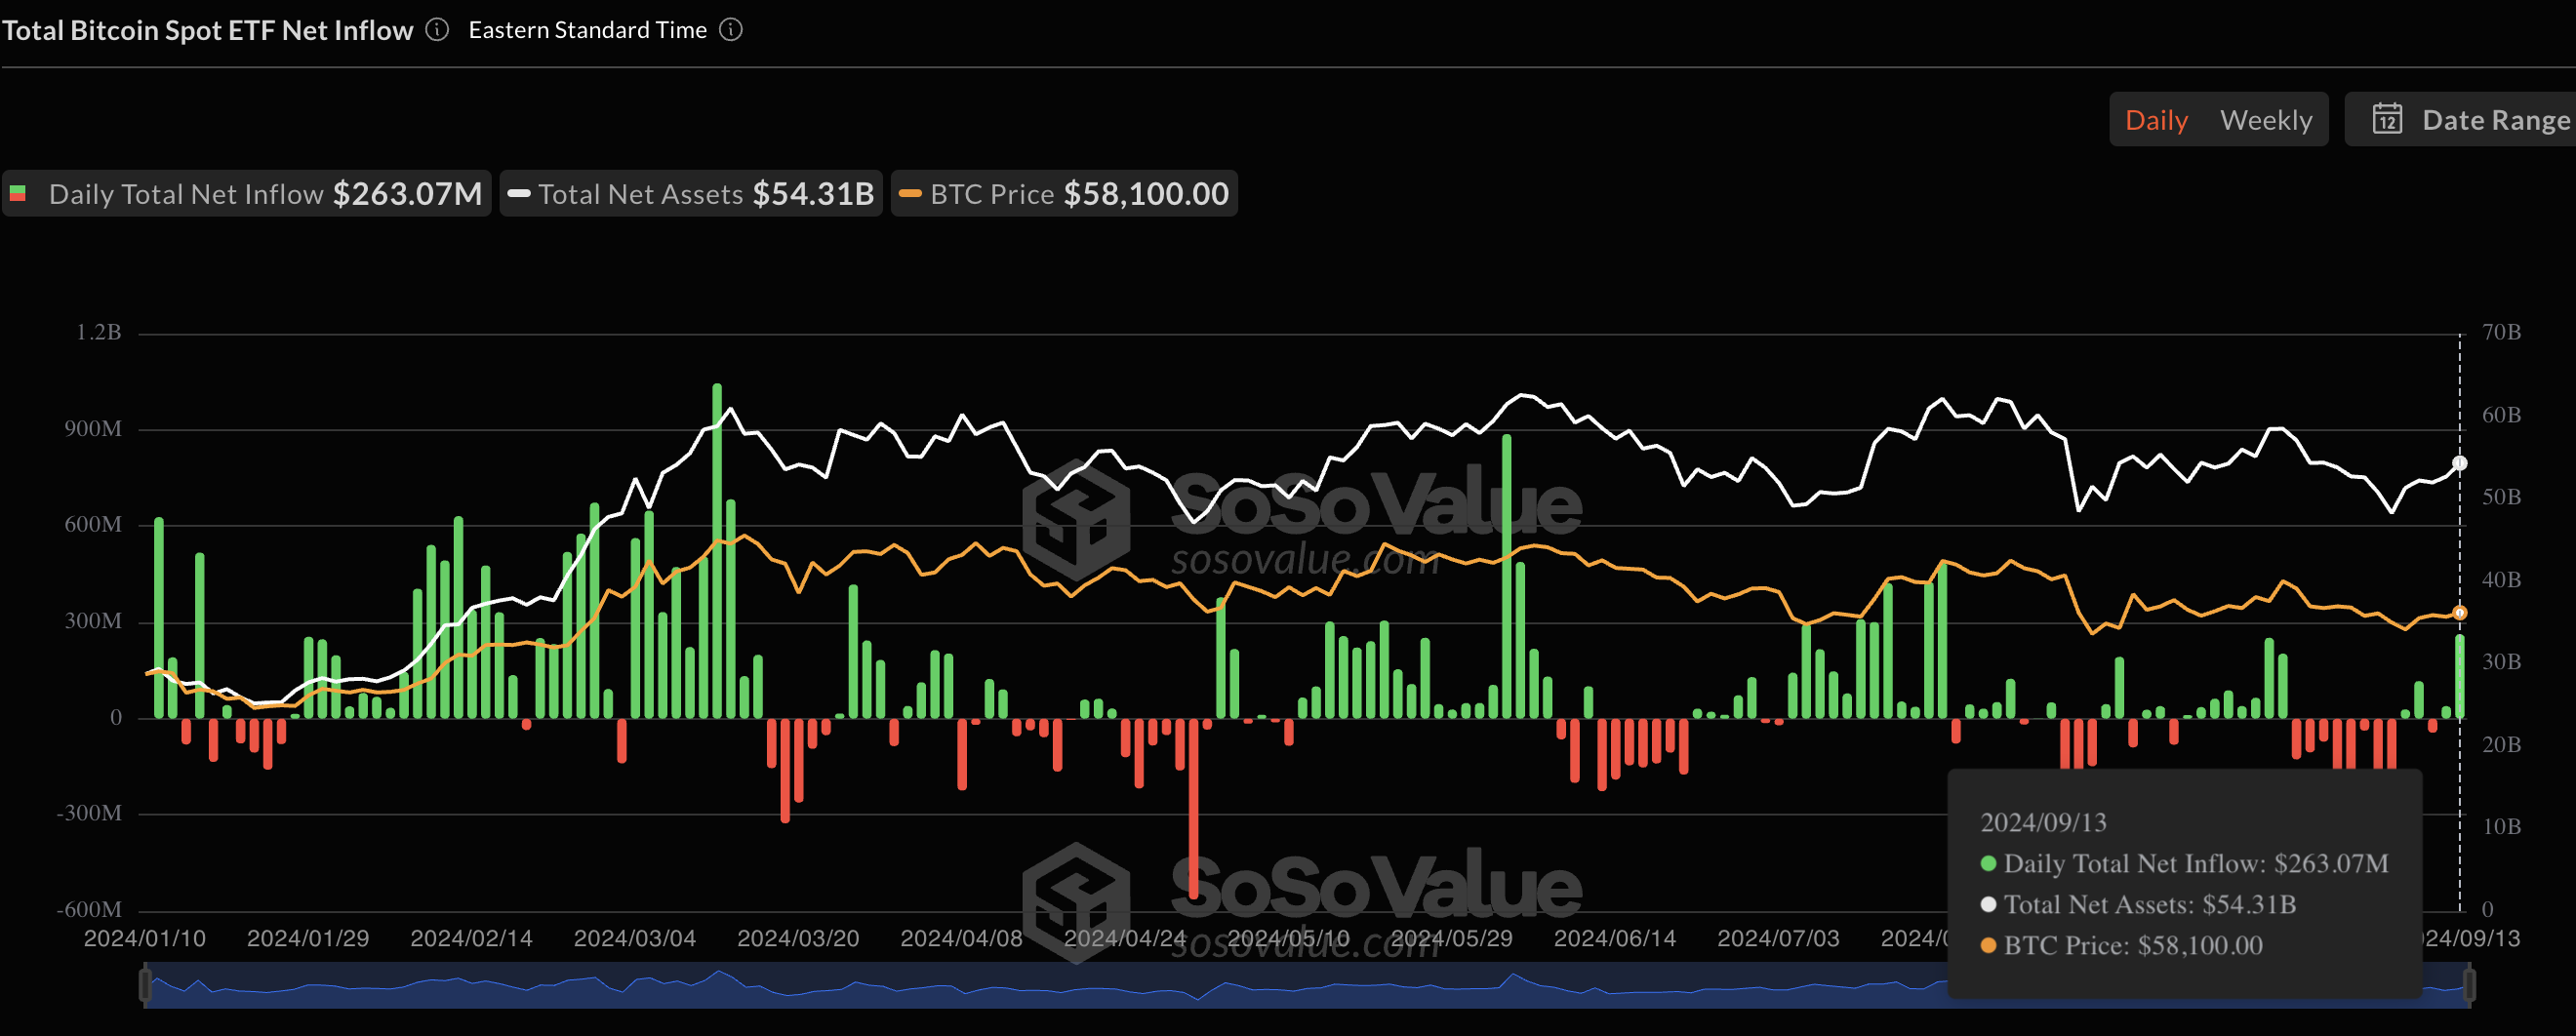
- Bitcoin Spot ETF inflow hit its highest level in over 50 days with $263 million positive net flow on Friday, September 13.
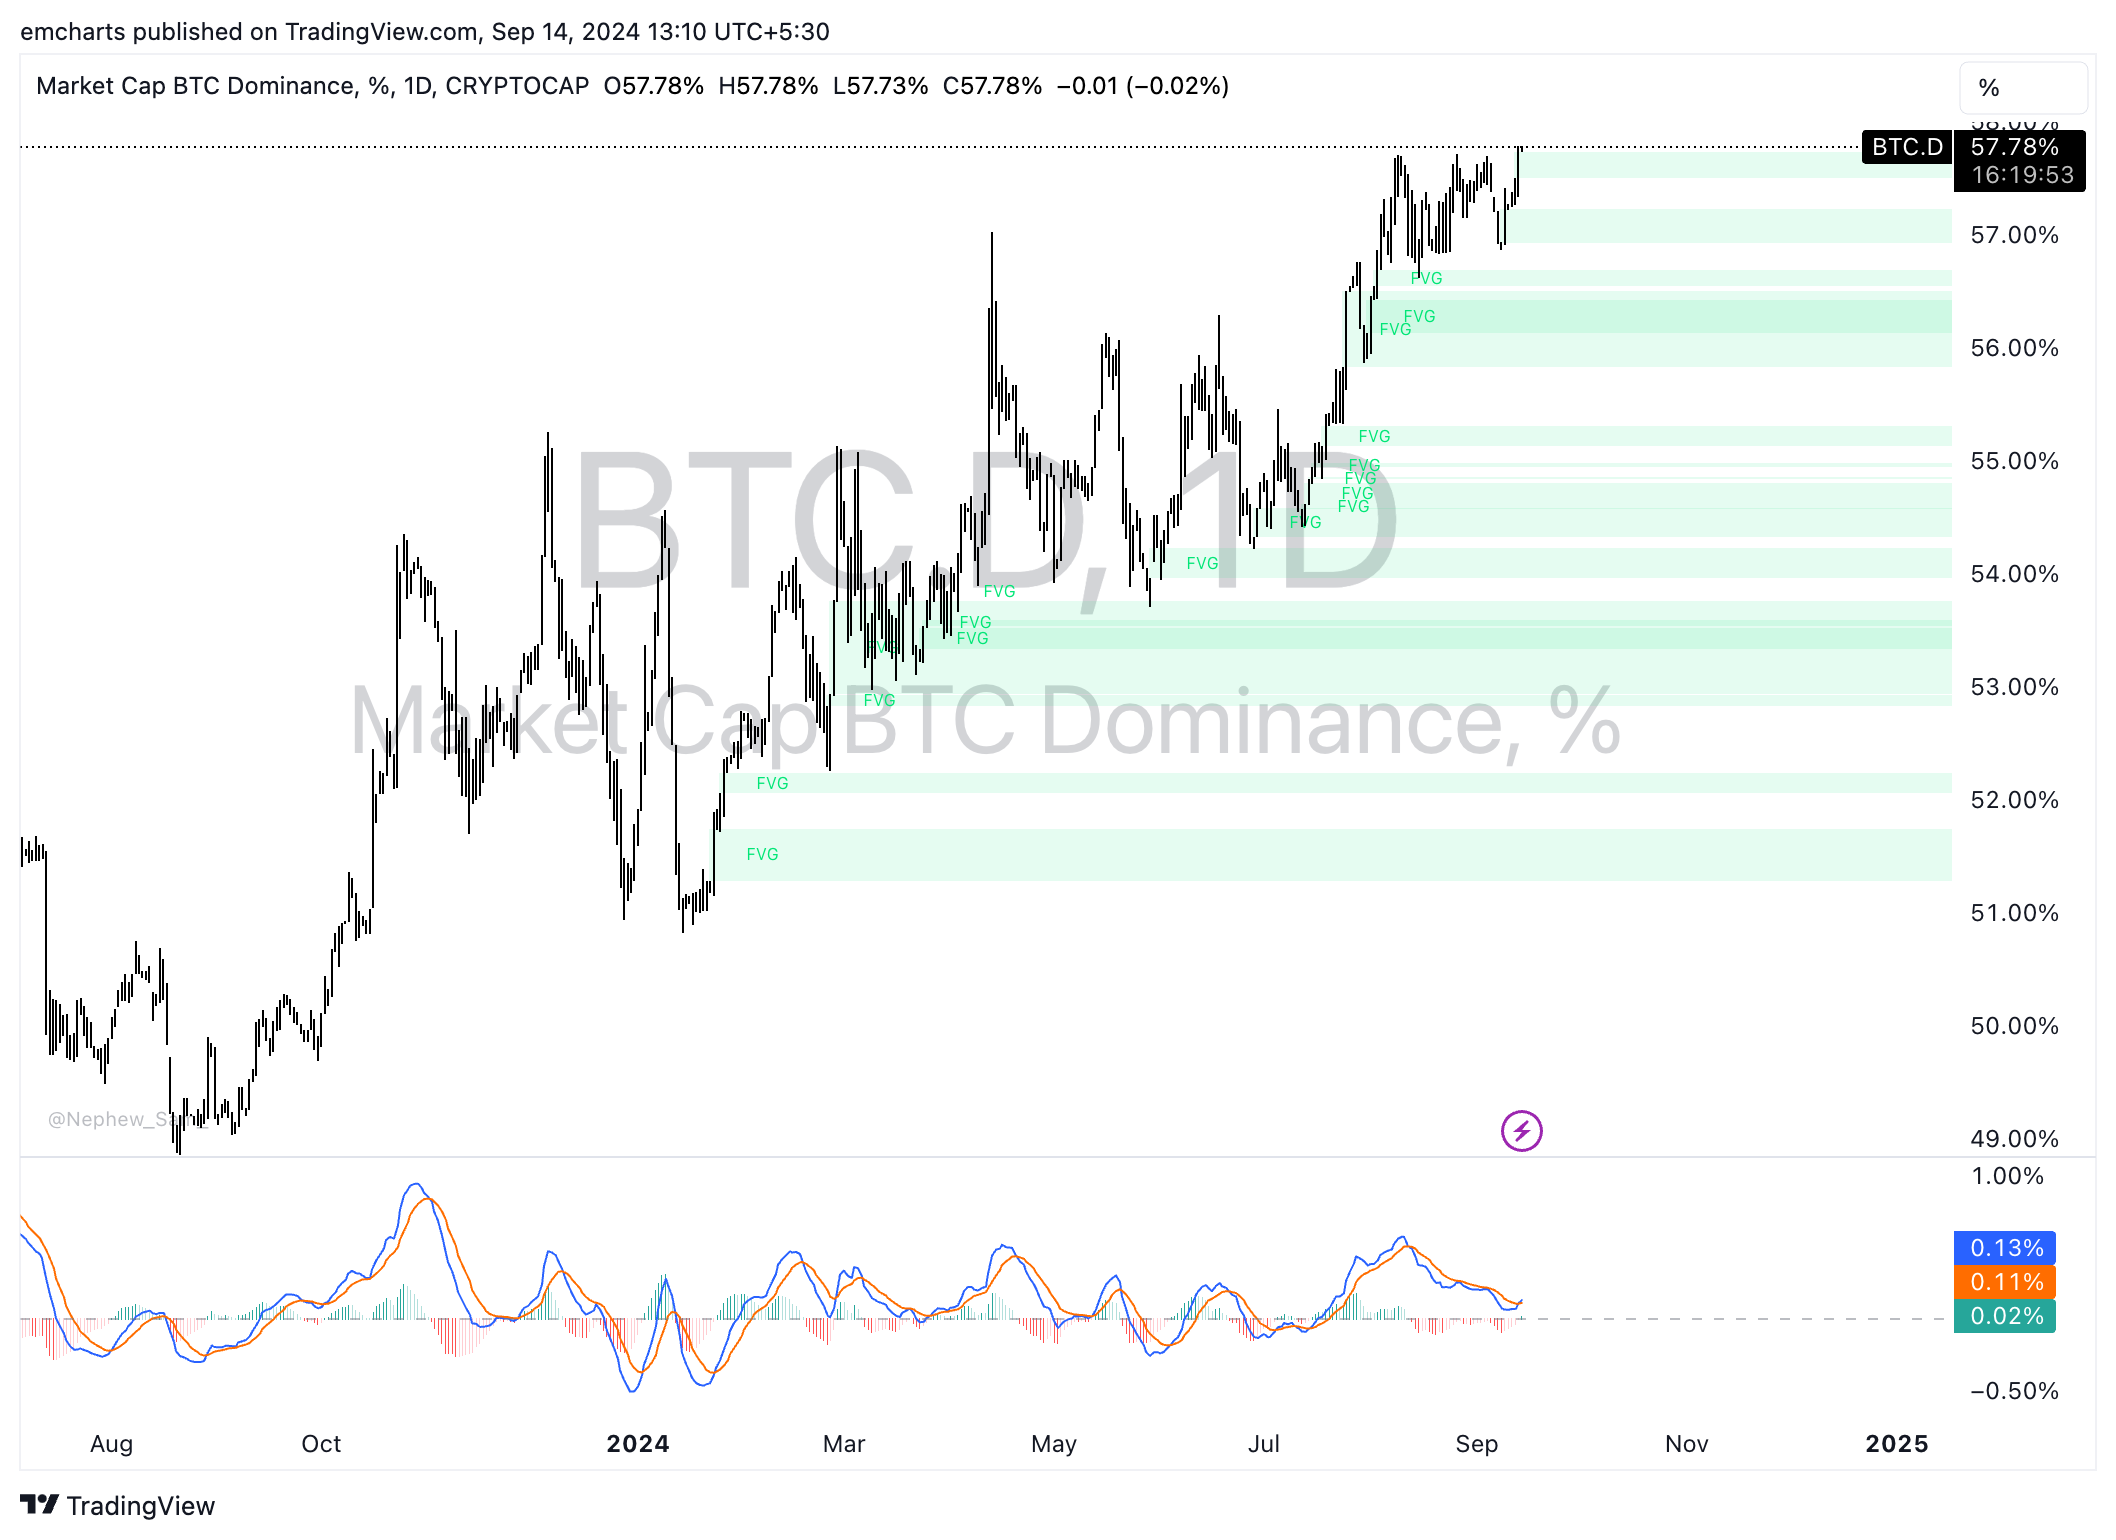
- Bitcoin dominance makes news highs almost everyday, climbs past 57% on Saturday.
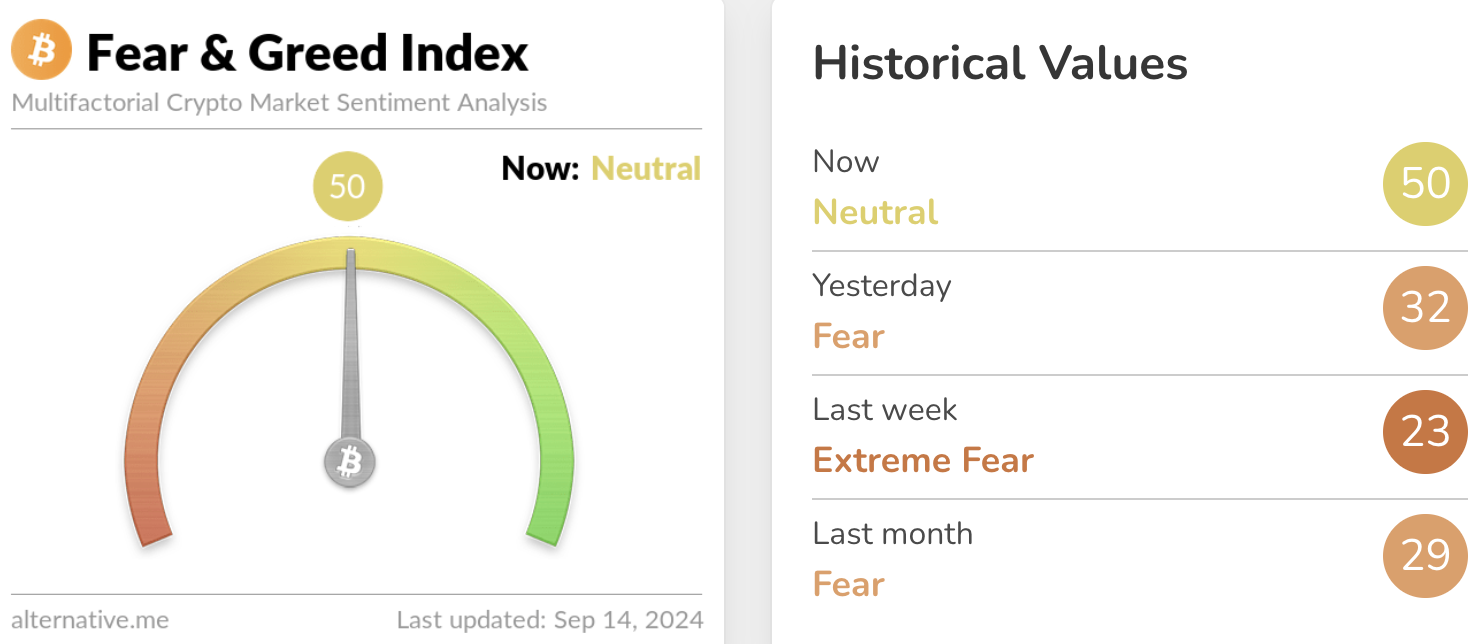
- BTC fear and greed index flashes neutral after asset breaks past $60,000 psychological barrier.
- BTC trades at $60,134 at the time of writing.
Bitcoin (BTC) Spot ETFs are considered a marker of institutional interest in the asset. Spot ETF inflows ended a negative streak with record net flows to the asset class on Friday, September 13.
Bitcoin’s dominance relative to other altcoins hit a new high, crossed the 57% level on Saturday.
These factors could catalyze gains in Bitcoin
The top three market movers for Bitcoin are institutional capital inflow, dominance and supply of the asset on exchanges. These factors determine the demand for the asset, its relevance among market participants, compared to other cryptocurrencies (altcoins) and the selling pressure on BTC, eventually influencing Bitcoin price.
Data from crypto intelligence tracker Sosovalue shows that Bitcoin Spot ETFs ended the week with record inflows, $263.07 million on Friday. This is the highest capital inflow since July 2024, in nearly 50 days.
Institutional capital inflow to Bitcoin is key since it represents demand among large wallet investors and higher inflow and demand typically fuel gains in BTC.
Bitcoin Spot ETF inflows
The fear and greed index measures the sentiment among Bitcoin traders. The index reads neutral on Saturday, as Bitcoin makes a comeback above the psychological barrier of $60,000.
Bitcoin fear and greed index
The asset’s supply on exchanges is now at its lowest point since 2018. Declining exchange supply is considered a positive sign for the cryptocurrency since it reduces the available tokens for sale on exchange platforms and reduces selling pressure.
Bitcoin supply has dropped to 1.86 million, down from 3.21 million in March 2020, per Santiment data.
 [13.23.11, 14 Sep, 2024]-638618982688107961.png)
Bitcoin supply on exchanges
The asset’s dominance is the ratio of BTC market capitalization to the rest of the cryptocurrencies, namely altcoins. Dominance has hit a new high every few days, climbs to 57.78% on September 13.
While this yields negative returns for traders holding altcoins (Bitcoin pairs), it is considered a bullish sign for Bitcoin.
Bitcoin dominance
Bitcoin eyes $65,000 target
Bitcoin made a comeback above $60,000, trades at $60,134 at the time of writing. The asset could extend gains by 8% to target the $65,000 level. The Moving Average Convergence Divergence (MACD) indicator flashes green histogram bars above the neutral line, suggesting an underlying positive momentum in BTC price trend.
BTC could find support in the Fair Value Gap (FVG) between $58,588 and $59,900.
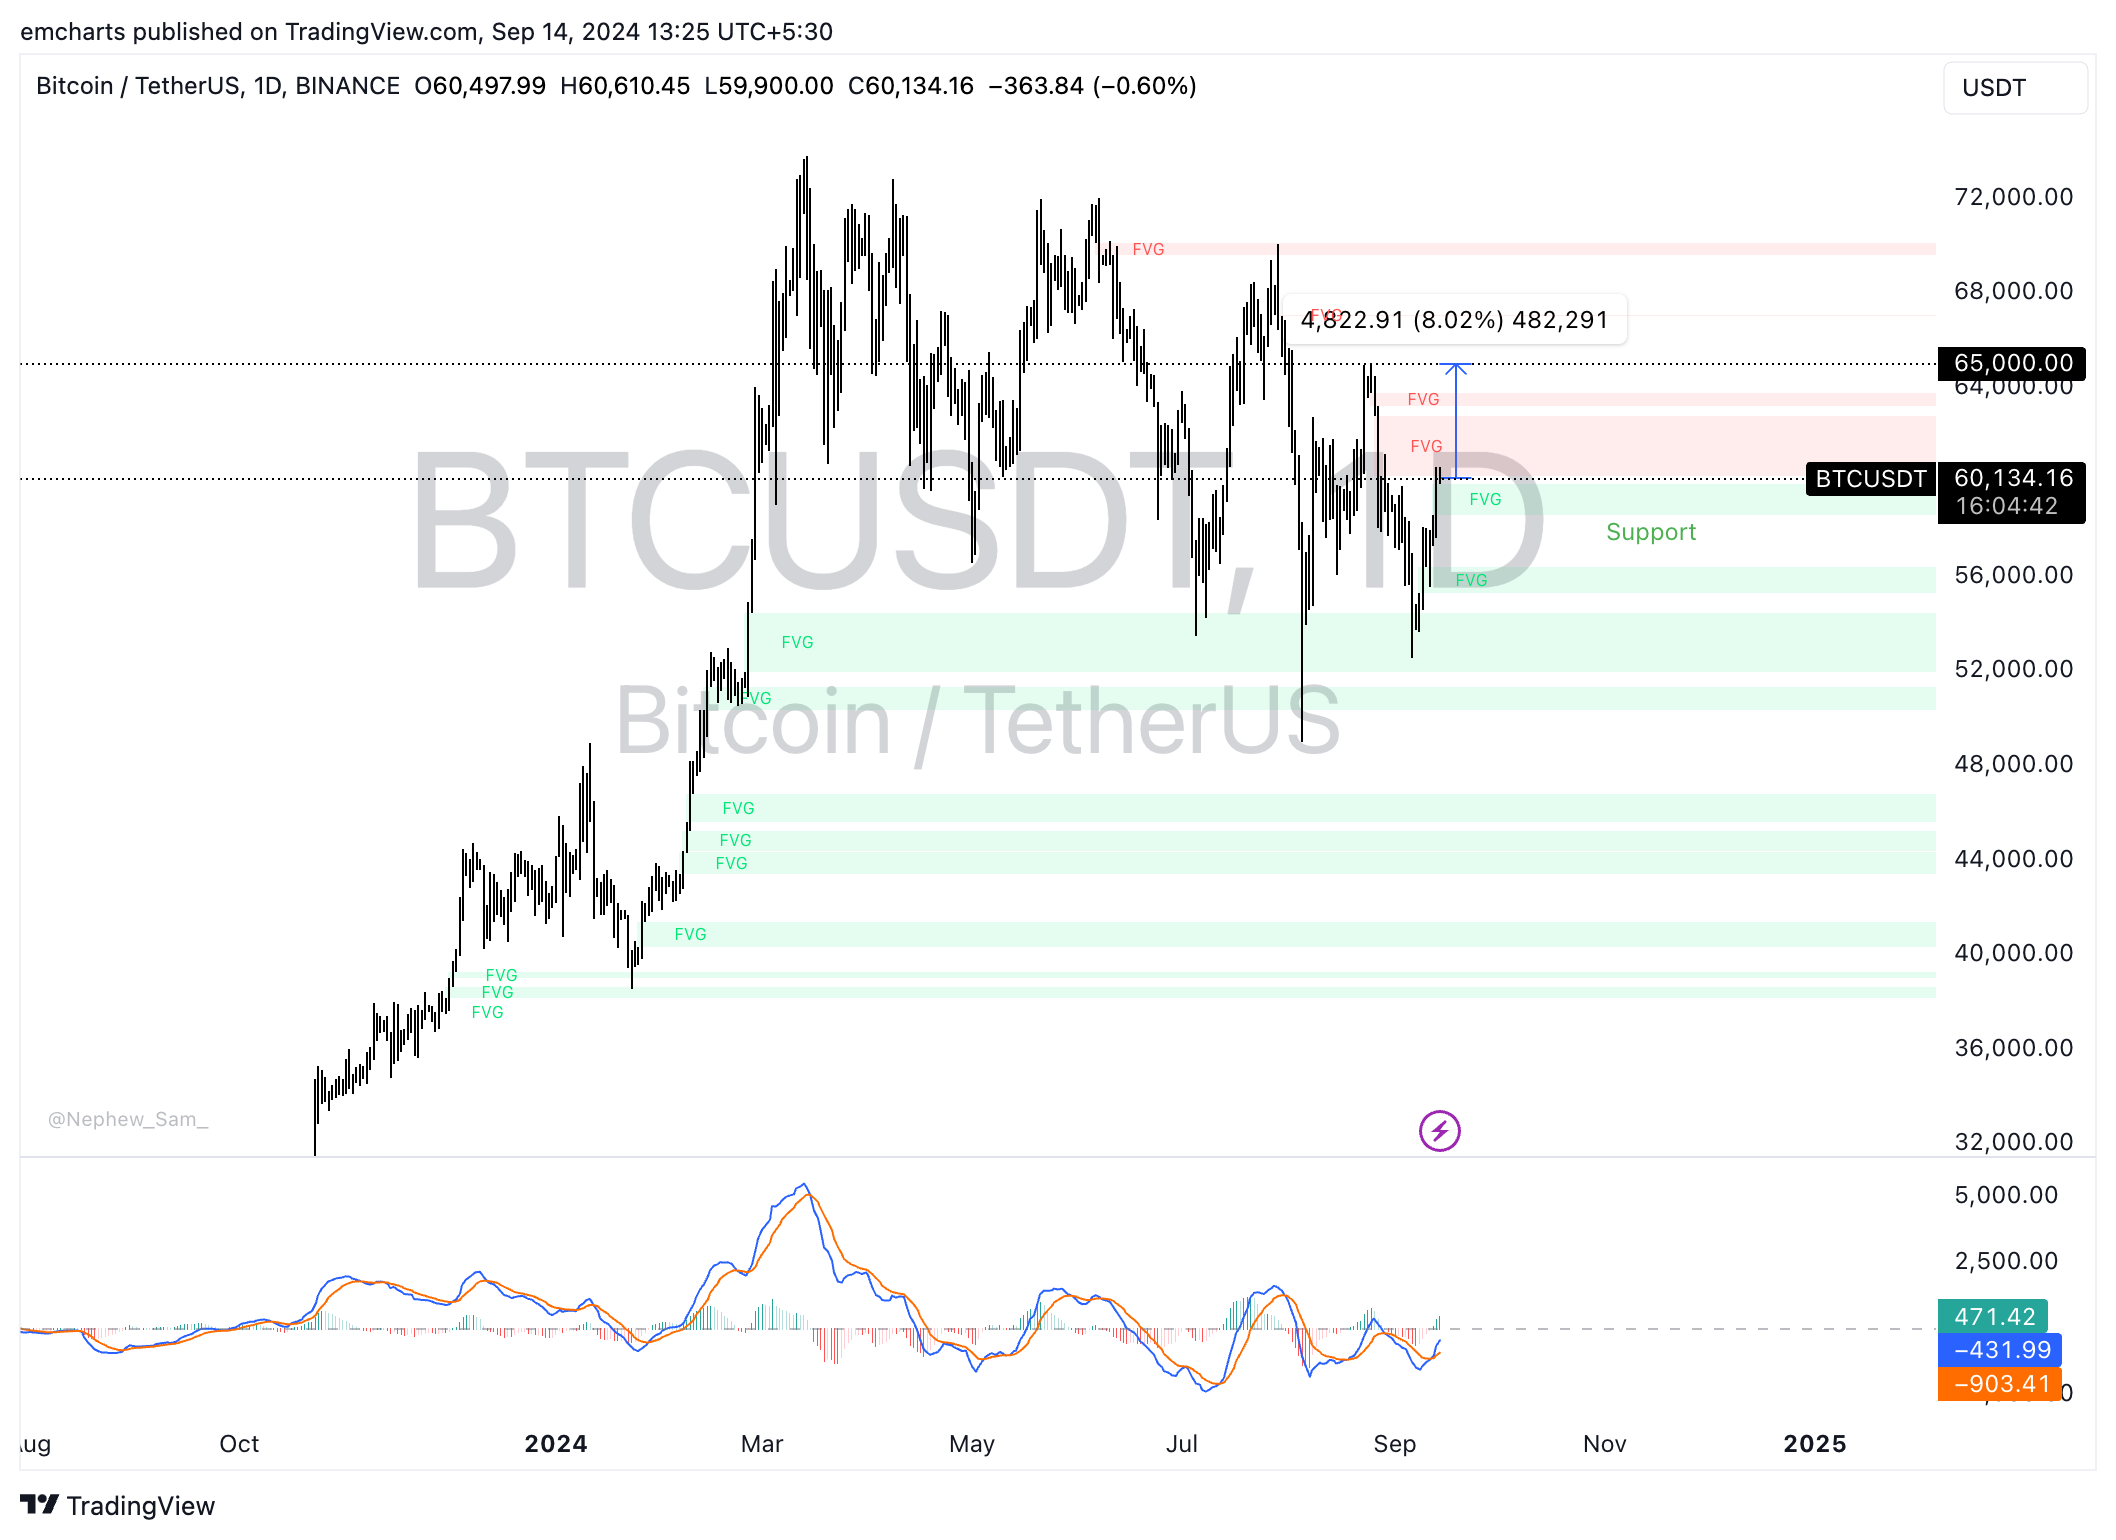
BTC/USDT daily chart
A daily candlestick close under $59,900, the upper boundary of the FVG, could invalidate the bullish thesis for Bitcoin.
추천 기사


