

Ethereum suffers declining investor interest following historical August market lull
- Ethereum ETFs posted $44.5 million in outflows last week, spearheaded by Grayscale's ETHE.
- The Layer 1's trading volume and transaction count dropped significantly as investors became increasingly risk-averse.
- Ethereum could continue consolidating after it failed to break above a key rectangle's resistance.
Ethereum (ETH) is down nearly 3% on Monday following a decrease in key metrics, including institutional interest, trading volume and transaction count. The decline is also evident in ETH's price, which has failed to overcome a key price resistance.
Daily digest market movers: Ethereum suffers historical August decline
Spot Ethereum ETFs in the US had a total net outflow of $44.5 million last week after recording seven consecutive days of negative flows. While the "new eight" saw minor inflows, the impact of Grayscale's ETHE $118 million outflows offset their positive flows.
The weak flows negatively affected ETH's price with a low weekly gain of 3%. To add insult to injury, the Ethereum Foundation potentially sold 35K ETH on Friday when the market saw a brief rise.
In comparison, Bitcoin ETFs have posted seven consecutive days of net inflows despite outflows in Grayscale's GBTC. This pattern suggests declining institutional interest in Ethereum, even with the market anticipating a rate cut from the Federal Reserve (Fed).
The Ethereum blockchain trading volume and transaction count in August also indicate waning investor interest in the top altcoin. According to data from The Block, the 7-day moving average of daily trading volume on the top Layer 1 dropped from $6.56 billion on July 26 to $2.9 billion on Monday.
While the decline may have been attributed to the recent market crash, Ethereum's monthly transaction count also dropped to 27.27 million — a low last recorded in May 2020 — with only five days left in August. This confirms a risk-averse attitude among investors that aligns with a historical summer decline for Ethereum.
On the bright side, Coinbase analysts David Duong and David Han highlighted that the decline in Ethereum activity this August wasn't as heavy as that of previous years.
"The decrease in ether trading volumes in August compared to the preceding three months has been a modest 7.7%, compared to the average 16.8% decline observed over the last five years," noted Coinbase analysts.
ETH technical analysis: Key resistance prevents reclaim of key support level
Ethereum is trading around $2,700 on Monday, down 2.5% on the day. In the past 24 hours, ETH has sustained liquidations worth $21.35 million, with long and short liquidations accounting for $17.17 million and $4.17 million, respectively.
Ethereum tested the resistance at $2,817 on Saturday but quickly retraced after reaching its highest price since the market crash on August 5.
The price decline after ETH posted a long-legged Doji candle confirmed the reversal. Doji candles reflect indecision among traders and are often used to detect price/trend reversals.
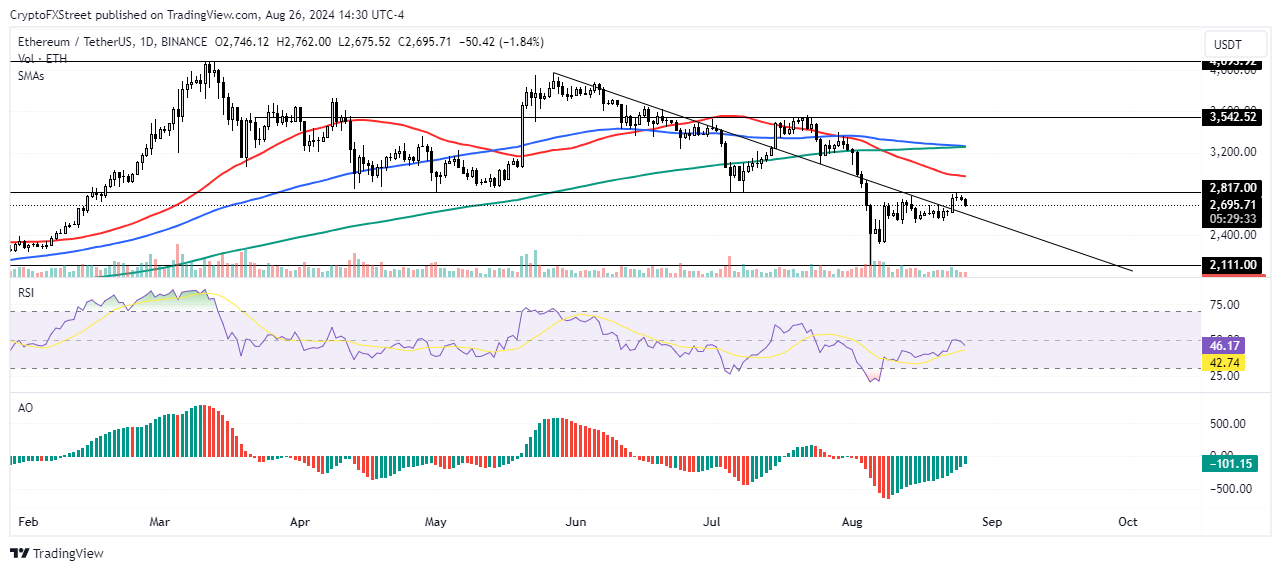
ETH/USDT Daily chart
The move has kept ETH's price trading within a key rectangle, as reflected in the chart above. A daily candlestick above the upper horizontal line resistance would see ETH reclaim a major support level that held for nearly six months. If ETH completes such a move, it could begin trading within another key rectangle and rally toward the resistance around $3,542.
A breakout above $3,542 could see ETH tackle its yearly resistance at $4,093 and establish a new all-time high. The 200-day and 100-day Simple Moving Averages (SMA) serve as potential resistance.
The Simple Moving Average (SMA) of the Relative Strength Index (RSI) has been rising since posting a lower low on August 15. If the SMA crosses above its midline, it signals a potential bullish momentum reversal.
Since August 10, the Awesome Oscillator (AO) has been posting consecutive lower green bars. If these green bars continue and the AO moves above zero, it will also signal a potential bullish reversal.
In conclusion, ETH may consolidate for a few weeks before staging a proper rally. A daily candlestick close below the support at $2,111 will invalidate the thesis.
Ethereum FAQs
Ethereum is a decentralized open-source blockchain with smart contracts functionality. Serving as the basal network for the Ether (ETH) cryptocurrency, it is the second largest crypto and largest altcoin by market capitalization. The Ethereum network is tailored for scalability, programmability, security, and decentralization, attributes that make it popular among developers.
Ethereum uses decentralized blockchain technology, where developers can build and deploy applications that are independent of the central authority. To make this easier, the network has a programming language in place, which helps users create self-executing smart contracts. A smart contract is basically a code that can be verified and allows inter-user transactions.
Staking is a process where investors grow their portfolios by locking their assets for a specified duration instead of selling them. It is used by most blockchains, especially the ones that employ Proof-of-Stake (PoS) mechanism, with users earning rewards as an incentive for committing their tokens. For most long-term cryptocurrency holders, staking is a strategy to make passive income from your assets, putting them to work in exchange for reward generation.
Ethereum transitioned from a Proof-of-Work (PoW) to a Proof-of-Stake (PoS) mechanism in an event christened “The Merge.” The transformation came as the network wanted to achieve more security, cut down on energy consumption by 99.95%, and execute new scaling solutions with a possible threshold of 100,000 transactions per second. With PoS, there are less entry barriers for miners considering the reduced energy demands.
추천 기사


