

Crude Oil edges up, in second consecutive attempt to overcome $70
- Crude Oil edges higher as Russia responds to Ukraine’s missile attacks by launching an intercontinental ballistic missile for the first time in the war.
- The Russian missile attack targeted critical infrastructure in the city of Dnipro.
- The US Dollar Index is being fueled by safe-haven inflows, though it faces resistance.
Crude Oil prices are trying to break above $70 for a second consecutive day, fueled by headlines that Russia has launched a ballistic missile into Ukraine for the first time in the war, Bloomberg reports. On Wednesday, Oil already tried to overcome the round $70 level, but failed to do so after headlines emerged that both Ukraine and Russia are willing to hold talks to resolve the current stalemate situation. Any headlines pointing to this possibility could trigger a knee-jerk reaction for Oil prices.
Meanwhile, the US Dollar Index (DXY) is flat, supported by safe-haven inflows on the back the war between Ukraine and Russia. On the other hand, New York Fed President John Williams delivered dovish comments, saying that inflation is set to decline further and interest rates should head lower as well. All this together, coupled with disappointing Nvidia earnings overnight, sees the DXY US Dollar Index not really going anywhere.
At the time of writing, Crude Oil (WTI) trades at $69.48 and Brent Crude at $73.25.
Oil news and market movers: Biden makes his last moves
- Although Oil prices are rising, the options markets are not showing any concerns for the near future, which could mean that a further escalation is not foreseen.
- The Biden administration has recognized opposition candidate Edmundo González as Venezuela’s president-elect, a move that may make it harder for the incoming Trump administration to cut a deal with Nicolás Maduro, Bloomberg reports. Venezuela is a key producer of Oil in Latin America and it has the world’s largest Oil reserves.
- US inventories of crude Oil rose for the third straight week as a rebound in Oil exports offset a massive inflow of imported supplies into the Gulf Coast, the weekly report from the Energy Information Administration (EIA) revealed on Wednesday.
Oil Technical Analysis: Limited potential forecasted
Crude Oil price might be ticking up, supported by the geopolitical tensions between Russia and Ukraine. Still, markets seem to be taking these moves with a pinch of salt as the actual Oil market is still very much flooded with more supply than demand. So, the overall longer term outlook has not changed.
On the upside, the 55-day Simple Moving Average (SMA) at $70.08 is the first barrier to consider before the 100-day SMA steps in at $72.89. The 200-day SMA at $76.48 is still quite far off, although it could be tested if tensions intensify further.
On the other side, traders need to look towards $67.12 – a level that held the price in May and June 2023 – to find the first support. In case that breaks, the 2024 year-to-date low emerges at $64.75, followed by $64.38, the low from 2023.
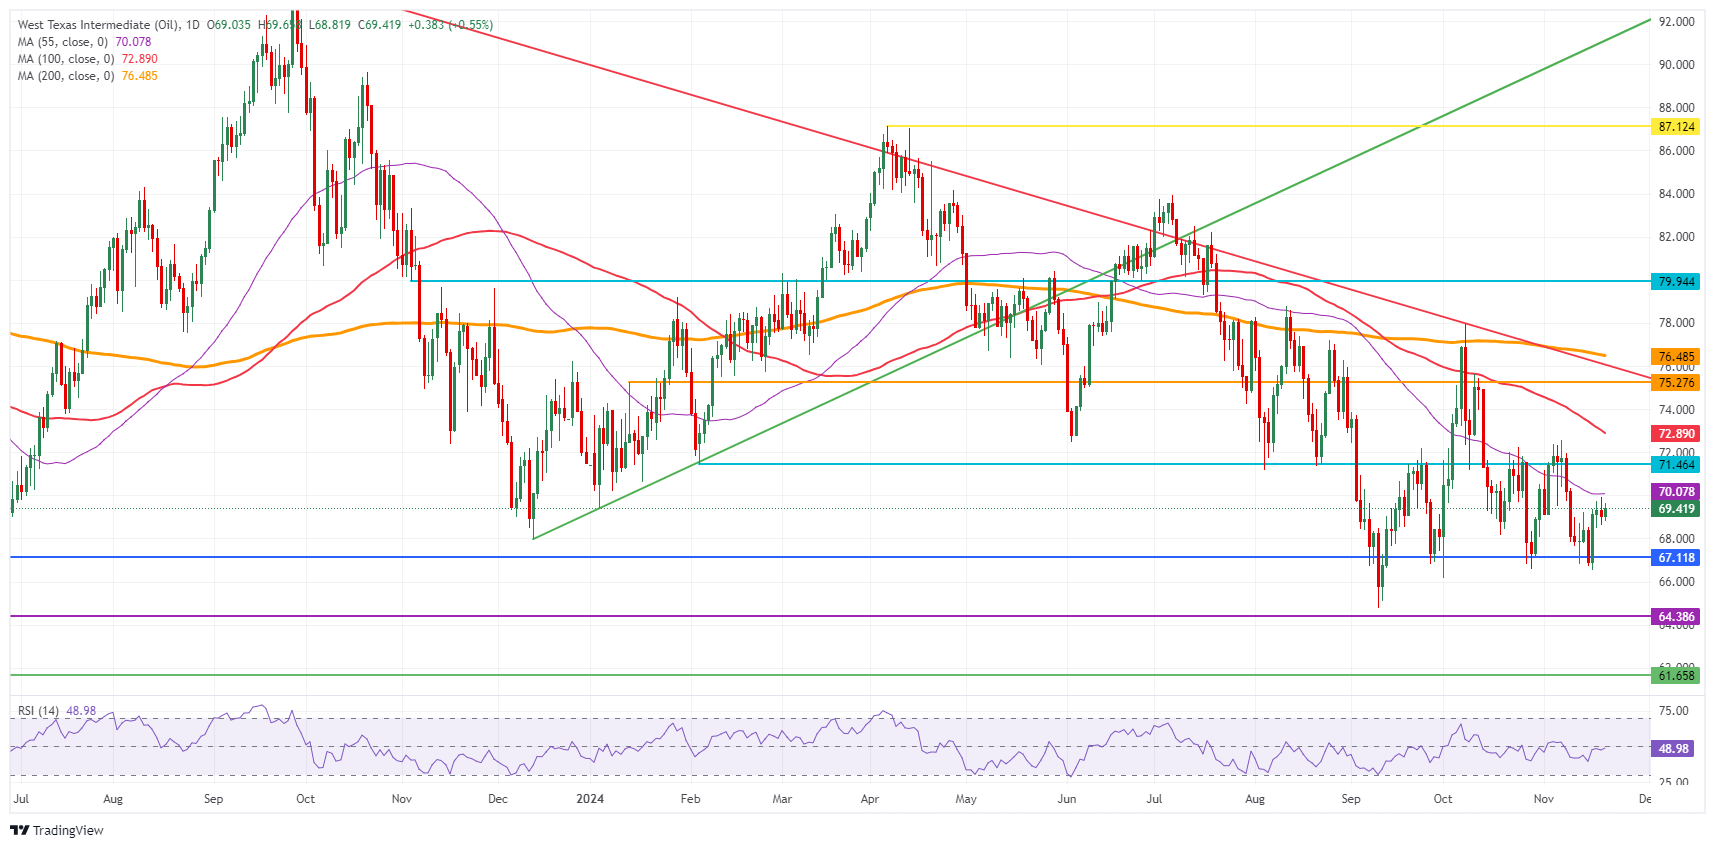
US WTI Crude Oil: Daily Chart
WTI Oil FAQs
WTI Oil is a type of Crude Oil sold on international markets. The WTI stands for West Texas Intermediate, one of three major types including Brent and Dubai Crude. WTI is also referred to as “light” and “sweet” because of its relatively low gravity and sulfur content respectively. It is considered a high quality Oil that is easily refined. It is sourced in the United States and distributed via the Cushing hub, which is considered “The Pipeline Crossroads of the World”. It is a benchmark for the Oil market and WTI price is frequently quoted in the media.
Like all assets, supply and demand are the key drivers of WTI Oil price. As such, global growth can be a driver of increased demand and vice versa for weak global growth. Political instability, wars, and sanctions can disrupt supply and impact prices. The decisions of OPEC, a group of major Oil-producing countries, is another key driver of price. The value of the US Dollar influences the price of WTI Crude Oil, since Oil is predominantly traded in US Dollars, thus a weaker US Dollar can make Oil more affordable and vice versa.
The weekly Oil inventory reports published by the American Petroleum Institute (API) and the Energy Information Agency (EIA) impact the price of WTI Oil. Changes in inventories reflect fluctuating supply and demand. If the data shows a drop in inventories it can indicate increased demand, pushing up Oil price. Higher inventories can reflect increased supply, pushing down prices. API’s report is published every Tuesday and EIA’s the day after. Their results are usually similar, falling within 1% of each other 75% of the time. The EIA data is considered more reliable, since it is a government agency.
OPEC (Organization of the Petroleum Exporting Countries) is a group of 12 Oil-producing nations who collectively decide production quotas for member countries at twice-yearly meetings. Their decisions often impact WTI Oil prices. When OPEC decides to lower quotas, it can tighten supply, pushing up Oil prices. When OPEC increases production, it has the opposite effect. OPEC+ refers to an expanded group that includes ten extra non-OPEC members, the most notable of which is Russia.
추천 기사


