
Crude Oil finds cushion even as traders expect more downside under Trump
- Crude Oil finds a small floor, trading mildly in the green on Tuesday, after two sessions of sharp losses.
- Several analysts are projecting a $40 price per barrel under Trump’s presidency.
- The US Dollar Index rallies further with the Trump trade sweeping markets.
Crude Oil trades broadly in the green on Tuesday after briefly ticking below $68.00, trying to recover from two consecutive sessions of sharp losses. The Organization of the Petroleum Exporting Countries (OPEC) report released on Tuesday spelled out the obvious element of oversupply, with OPEC revising down its global Oil demand forecast for a fourth time in a row. Analyst oil economist Phil Verleger calls for the possibility of prices falling to $40 per barrel once President-elect Donald Trump takes office due to expectations of additional support for shale and other Oil mining projects jointly with tariffs on China, which would translate into higher supply.
The US Dollar Index (DXY), which tracks the performance of the Greenback against six other currencies, is extending Monday’s gains. The Trump trade is sending the Greenback surging against all major G20 trade currencies with no exceptions. Expectations that the Fed will still cut interest rates further this year, together with the announced stimulus packages from President-elect Donald Trump, offer a small Goldilocks scenario for the US Dollar (USD) and equities.
At the time of writing, Crude Oil (WTI) trades at $68.66 and Brent Crude at $72.31.
Oil news and market movers: Trump administration weighs on Oil
- Donald Trump's aggressive tariffs on imports may send energy prices sharply lower in the next two years, Dow Jones reports. The tariffs imposed would hurt the biggest demand parties in the Oil market, such as China and India.
- Russia’s seaborne crude exports rebounded in the latest week, with a jump in cargoes from the Arctic region helping to stabilize the four-week average, Bloomberg reports.
- The monthly OPEC report came in as expected, not bearing many new elements. The main takeaway is that OPEC has revised its global Oil demand downwards for the fourth month in a row.
Oil Technical Analysis: Trump trade to hurt Oil
Crude Oil prices have found some room to breathe but the outlook remains bleak. Even when OPEC could limit its production further, the US is set to offload even more volumes in the coming years under President Donald Trump. With the US probably becoming more and more independent on Oil imports, Crude Oil prices could correct further.
On the upside, The 55-day Simple Moving Average (SMA) at $70.51 is the first to be considered before the hefty technical level at $73.85, with the 100-day Simple Moving Average (SMA) and a few pivotal lines. The 200-day SMA at $76.74 is still quite far off, although it could get tested in case tensions in the Middle East arise.
Traders need to look much lower, towards $67.12 – a level that held the price in May and June 2023 – to find the first support. In case that level breaks, the 2024 year-to-date low emerges at $64.75, followed by $64.38, the low from 2023.
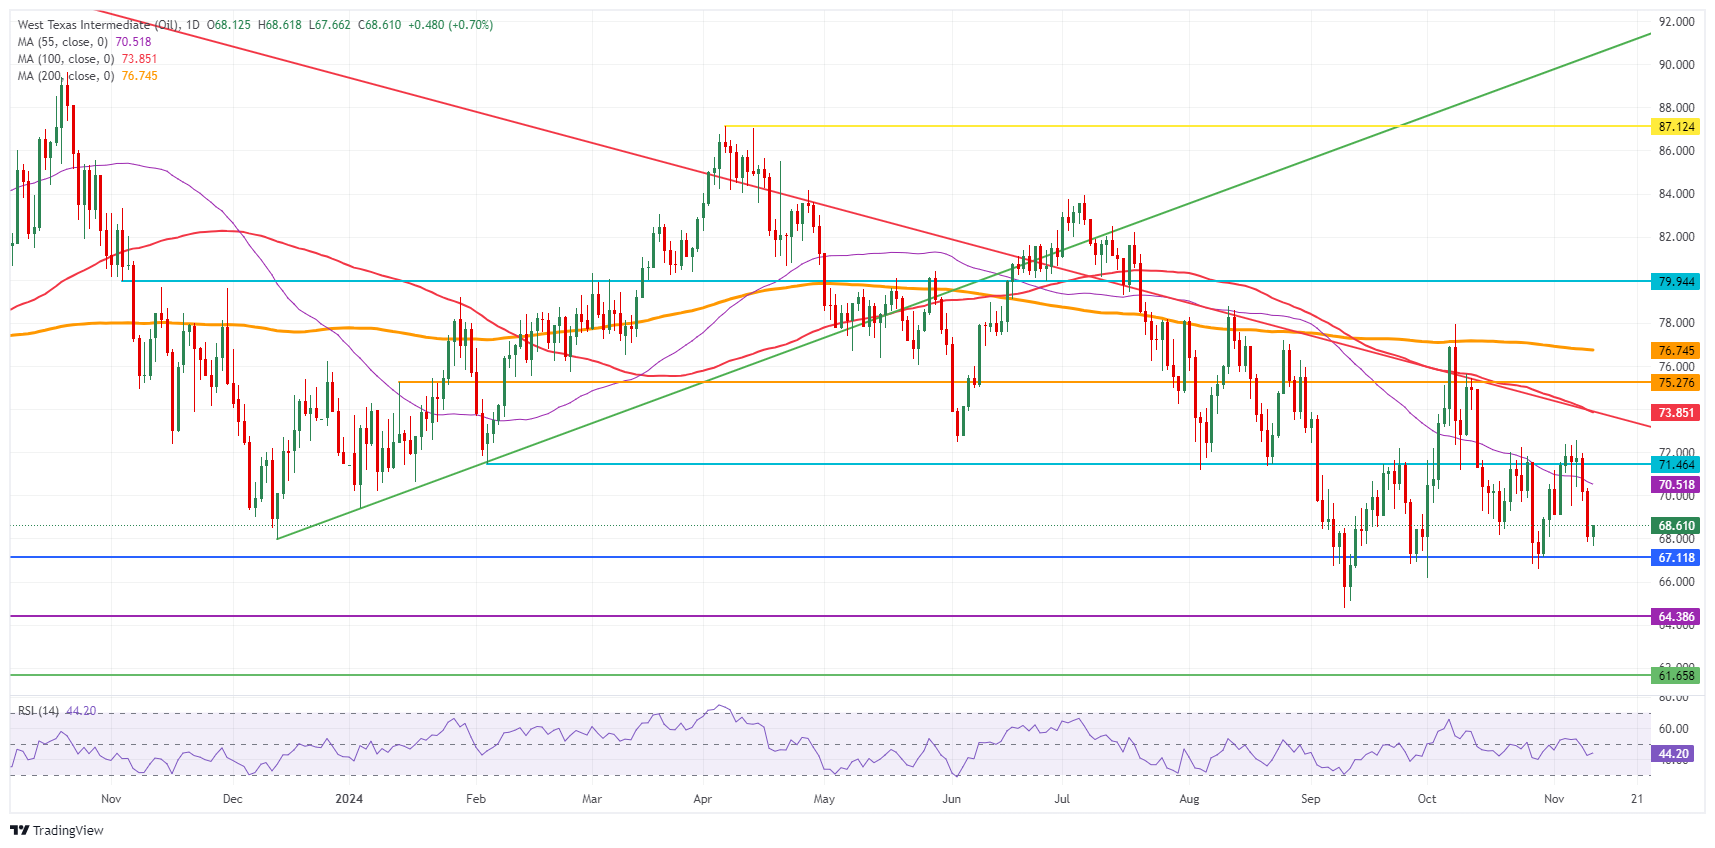
US WTI Crude Oil: Daily Chart
WTI Oil FAQs
WTI Oil is a type of Crude Oil sold on international markets. The WTI stands for West Texas Intermediate, one of three major types including Brent and Dubai Crude. WTI is also referred to as “light” and “sweet” because of its relatively low gravity and sulfur content respectively. It is considered a high quality Oil that is easily refined. It is sourced in the United States and distributed via the Cushing hub, which is considered “The Pipeline Crossroads of the World”. It is a benchmark for the Oil market and WTI price is frequently quoted in the media.
Like all assets, supply and demand are the key drivers of WTI Oil price. As such, global growth can be a driver of increased demand and vice versa for weak global growth. Political instability, wars, and sanctions can disrupt supply and impact prices. The decisions of OPEC, a group of major Oil-producing countries, is another key driver of price. The value of the US Dollar influences the price of WTI Crude Oil, since Oil is predominantly traded in US Dollars, thus a weaker US Dollar can make Oil more affordable and vice versa.
The weekly Oil inventory reports published by the American Petroleum Institute (API) and the Energy Information Agency (EIA) impact the price of WTI Oil. Changes in inventories reflect fluctuating supply and demand. If the data shows a drop in inventories it can indicate increased demand, pushing up Oil price. Higher inventories can reflect increased supply, pushing down prices. API’s report is published every Tuesday and EIA’s the day after. Their results are usually similar, falling within 1% of each other 75% of the time. The EIA data is considered more reliable, since it is a government agency.
OPEC (Organization of the Petroleum Exporting Countries) is a group of 12 Oil-producing nations who collectively decide production quotas for member countries at twice-yearly meetings. Their decisions often impact WTI Oil prices. When OPEC decides to lower quotas, it can tighten supply, pushing up Oil prices. When OPEC increases production, it has the opposite effect. OPEC+ refers to an expanded group that includes ten extra non-OPEC members, the most notable of which is Russia.
추천 기사


