
Crude Oil tests fresh seven-day low on continued concerns about demand
- Crude Oil further declines, breaking below the psychological $70.00 level.
- Traders still see concerns over Chinese demand and OPEC’s impasse as key issues leading to oversupply.
- The US Dollar Index jumps after President-elect Donald Trump enlarged his victory.
Crude Oil slides by more than 1% on Monday, piling on Friday’s losses and within touching distance of a seven-day low, ahead of the publication of the monthly OPEC report on Tuesday. Traders are already writing off the report as a non-event after OPEC already sidetracked on its production normalization last week by extending the measure by a month. Far from enough, traders also worry about Chinese demand for Oil once President-elect Donald Trump imposes tariffs on the country’s products.
The US Dollar Index (DXY), which tracks the performance of the Greenback against six other currencies, extends gains on Monday after headlines over the weekend that President-elect Donald Trump secured an additional swing state to its victory. All eyes are now on the count for the House of Representatives, where the Republicans are just four seats shy of the majority after already securing the Senate. Meanwhile, traders gear up for the US Consumer Price Index (CPI) on Wednesday.
At the time of writing, Crude Oil (WTI) trades at $69.00 and Brent Crude at $72.60.
Oil news and market movers: OPEC report to be a blank
- The monthly OPEC report is due Tuesday near 12:00 GMT.
- Several markets and asset classes are closed or trading at low volumes for this Monday on Veteran’s Day.
- Saudi Aramco reportedly will only sell around 36 million barrels of contractual supplies for December, against 42 million barrels in November, Reuters reports.
- Russian officials and business executives have held talks about merging the country’s biggest Oil companies into a single producer, the Wall Street Journal reported.
Oil Technical Analysis: Bearish again
Crude Oil prices are snapping lower again in search of a fresh one-week low. Traders’ expectations for any answers from OPEC on the oversupply issue look very minimal. The risk is that any form of communication from OPEC triggers more downside in Oil prices.
On the upside, The 55-day Simple Moving Average (SMA) at $70.66 is the first to be considered before the hefty technical level at $73.98, with the 100-day Simple Moving Average (SMA) and a few pivotal lines. The 200-day SMA at $76.77 is still quite far off, although it could get tested in case tensions in the Middle East arise.
Traders need to look much lower, towards $67.12, a level that held the price in May and June 2023, to find the first support. In case that level breaks, the 2024 year-to-date low emerges at $64.75, followed by $64.38, the low from 2023.
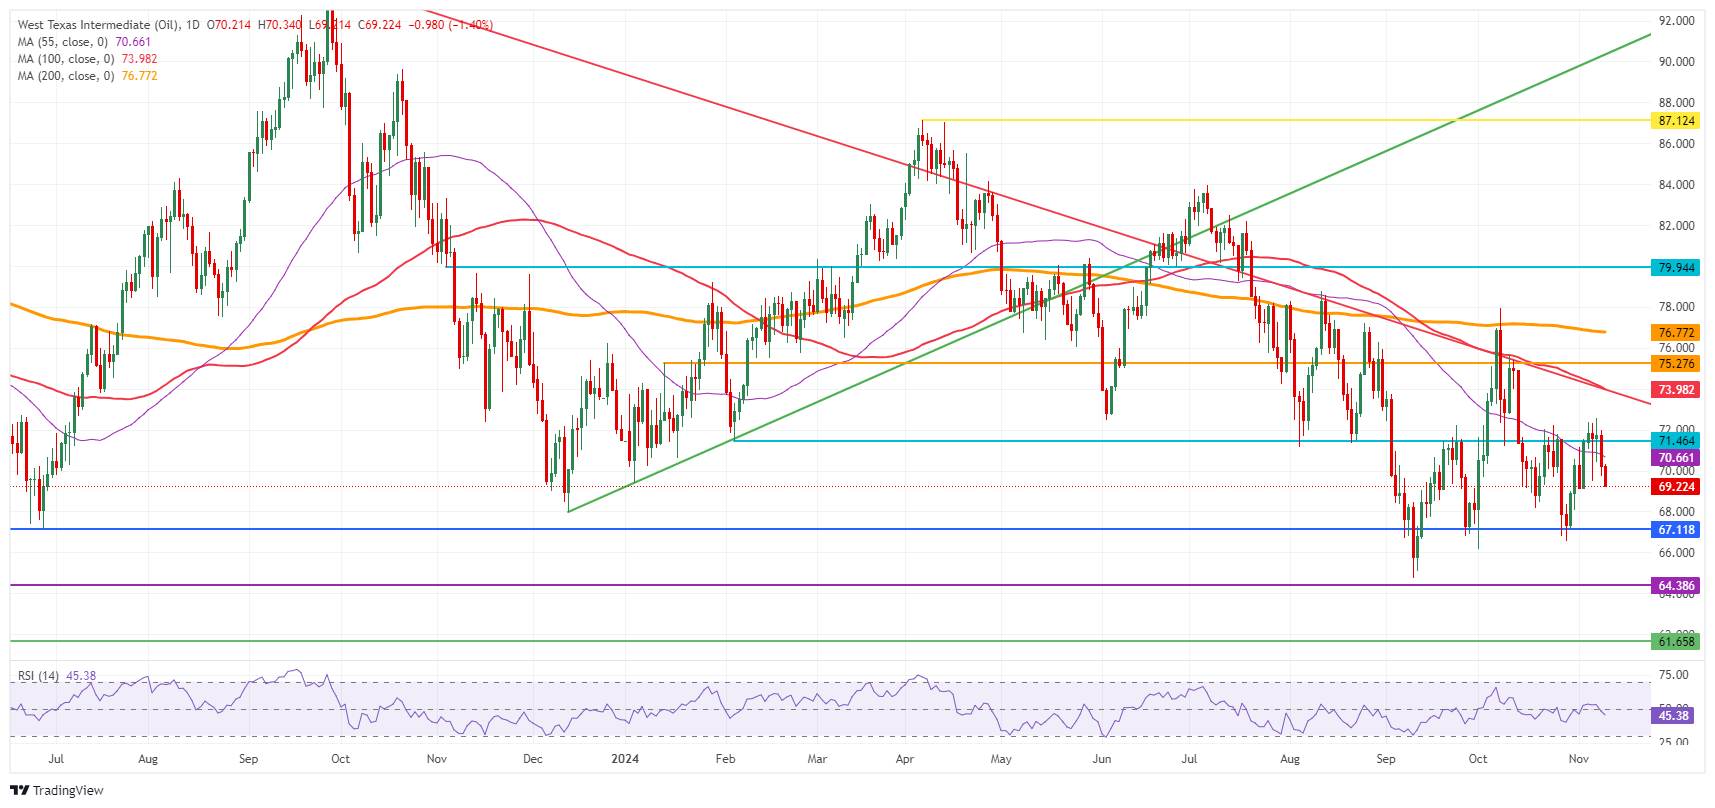
US WTI Crude Oil: Daily Chart
WTI Oil FAQs
WTI Oil is a type of Crude Oil sold on international markets. The WTI stands for West Texas Intermediate, one of three major types including Brent and Dubai Crude. WTI is also referred to as “light” and “sweet” because of its relatively low gravity and sulfur content respectively. It is considered a high quality Oil that is easily refined. It is sourced in the United States and distributed via the Cushing hub, which is considered “The Pipeline Crossroads of the World”. It is a benchmark for the Oil market and WTI price is frequently quoted in the media.
Like all assets, supply and demand are the key drivers of WTI Oil price. As such, global growth can be a driver of increased demand and vice versa for weak global growth. Political instability, wars, and sanctions can disrupt supply and impact prices. The decisions of OPEC, a group of major Oil-producing countries, is another key driver of price. The value of the US Dollar influences the price of WTI Crude Oil, since Oil is predominantly traded in US Dollars, thus a weaker US Dollar can make Oil more affordable and vice versa.
The weekly Oil inventory reports published by the American Petroleum Institute (API) and the Energy Information Agency (EIA) impact the price of WTI Oil. Changes in inventories reflect fluctuating supply and demand. If the data shows a drop in inventories it can indicate increased demand, pushing up Oil price. Higher inventories can reflect increased supply, pushing down prices. API’s report is published every Tuesday and EIA’s the day after. Their results are usually similar, falling within 1% of each other 75% of the time. The EIA data is considered more reliable, since it is a government agency.
OPEC (Organization of the Petroleum Exporting Countries) is a group of 12 Oil-producing nations who collectively decide production quotas for member countries at twice-yearly meetings. Their decisions often impact WTI Oil prices. When OPEC decides to lower quotas, it can tighten supply, pushing up Oil prices. When OPEC increases production, it has the opposite effect. OPEC+ refers to an expanded group that includes ten extra non-OPEC members, the most notable of which is Russia.
추천 기사


