


Silver Price Forecast: XAG/USD bears have the upper hand, ascending channel breakdown in play
- Silver trades with negative bias for the second straight day, though lacks follow-through selling.
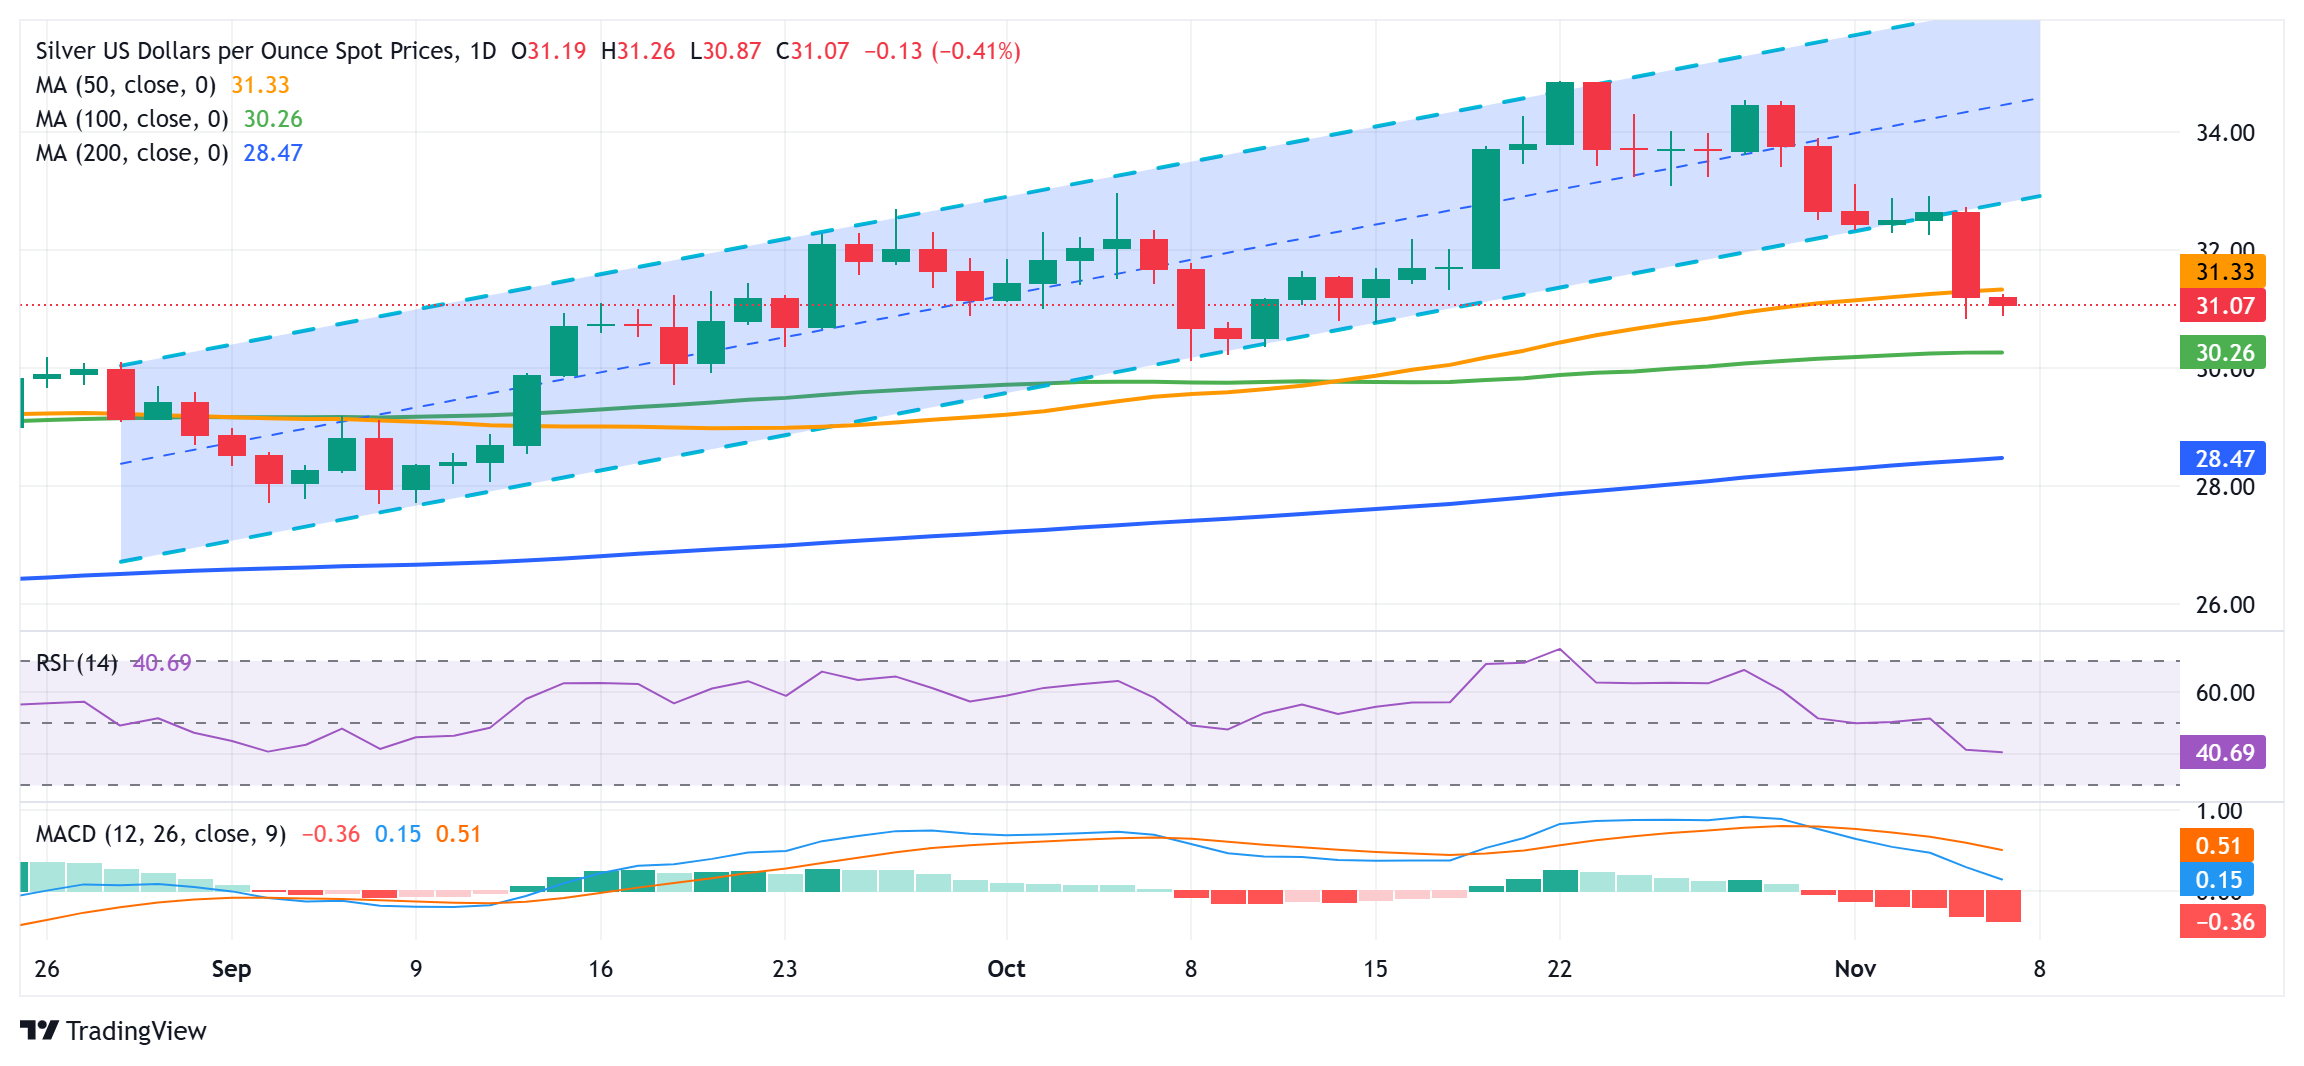
- A fall below the 50-day SMA validates an ascending channel breakdown and favors bearish traders.
- Any meaningful recovery attempt might now be seen as a selling opportunity and remain limited.
Silver (XAG/USD) remains on the back foot through the first half of the European session on Thursday, albeit manages to hold above the $31.00 mark. The technical setup, however, seems tilted in favor of bearish traders and suggests that the path of least resistance for the white metal remains to the downside.
The overnight downfall and a subsequent weakness below the 50-day Simple Moving Average (SMA) confirmed a short-term ascending trend-channel breakdown. Furthermore, oscillators on the daily chart have been gaining negative traction and add credence to the near-term negative outlook for the XAG/USD. Any further decline, however, is likely to find decent support near the 100-day SMA, currently pegged near the $30.40-$30.35 region.
Some follow-through selling could drag the XAG/USD below the $30.00 psychological mark, toward testing the next relevant support near the $29.70 zone. The downward trajectory could extend further towards the $29.00 round figure en route to the very important 200-day SMA, currently pegged near the $28.50-$28.40 region.
On the flip side, the 50-day SMA support breakpoint, around the $31.35 area, now seems to act as an immediate hurdle. A sustained strength beyond could trigger a short-covering rally towards the $31.75 intermediate resistance, the $32.00 round figure and the $32.25-$32.30 supply zone. Any further move up is more likely to attract fresh sellers and remain capped near the ascending channel support breakpoint, around the $32.75 region.
Silver daily chart
Silver FAQs
Silver is a precious metal highly traded among investors. It has been historically used as a store of value and a medium of exchange. Although less popular than Gold, traders may turn to Silver to diversify their investment portfolio, for its intrinsic value or as a potential hedge during high-inflation periods. Investors can buy physical Silver, in coins or in bars, or trade it through vehicles such as Exchange Traded Funds, which track its price on international markets.
Silver prices can move due to a wide range of factors. Geopolitical instability or fears of a deep recession can make Silver price escalate due to its safe-haven status, although to a lesser extent than Gold's. As a yieldless asset, Silver tends to rise with lower interest rates. Its moves also depend on how the US Dollar (USD) behaves as the asset is priced in dollars (XAG/USD). A strong Dollar tends to keep the price of Silver at bay, whereas a weaker Dollar is likely to propel prices up. Other factors such as investment demand, mining supply – Silver is much more abundant than Gold – and recycling rates can also affect prices.
Silver is widely used in industry, particularly in sectors such as electronics or solar energy, as it has one of the highest electric conductivity of all metals – more than Copper and Gold. A surge in demand can increase prices, while a decline tends to lower them. Dynamics in the US, Chinese and Indian economies can also contribute to price swings: for the US and particularly China, their big industrial sectors use Silver in various processes; in India, consumers’ demand for the precious metal for jewellery also plays a key role in setting prices.
Silver prices tend to follow Gold's moves. When Gold prices rise, Silver typically follows suit, as their status as safe-haven assets is similar. The Gold/Silver ratio, which shows the number of ounces of Silver needed to equal the value of one ounce of Gold, may help to determine the relative valuation between both metals. Some investors may consider a high ratio as an indicator that Silver is undervalued, or Gold is overvalued. On the contrary, a low ratio might suggest that Gold is undervalued relative to Silver.
추천 기사


