

Gold retreats as global factors ease, Fed to be more measured
- Gold retreats at the end of the week as the effect of Chinese stimulus fades and global central banks adopt a more cautious stance.
- Stronger US labor market and economic growth data lower the chances of the Fed easing aggressively.
- Gold price retreats as less dovish interest rate prospects and a stronger US Dollar are bearish.
Gold (XAU/USD) edges lower to trade in the $2.660s per troy ounce on Friday, as the impact of Chinese government stimulus starts to ebb and central banks globally adopt a less dovish stance.
In addition, better-than-expected data out of the US lowered the chances of the Fed making another aggressive 50 basis point (bps) rate cut in November. This further weighs on Gold as expectations of interest rates falling at a slower pace suggest a high opportunity cost of holding the non-interest-bearing asset. The USD is recovering too, adding to the precious metal’s headwinds.
Gold edges lower after making new record highs
Gold pulls back after touching a new record high of $2,685 on Thursday, as the effect of the extra 1 trillion CNY of stimulus announced by the Chinese Politburo appears to have been priced in and central banks globally tend to adopt a less dovish stance. The Central Bank of Sri Lanka kept rates unchanged at their meeting, and the Swiss National Bank (SNB) and Bank of Mexico (Banxico) cut rates by only 25 bps. A recent Reuters poll, meanwhile, showed that the Reserve Bank of India (RBI) is expected to cut interest rates by a modest 50 bps over the next six months.
In addition, the expectation that the Fed would cut interest rates by half a percent at their meeting in November has eased after positive US macroeconomic data. US Initial Jobless Claims showed a decline to 218K in the week ending September 20, and the final estimate of Q2 Gross Domestic Product (GDP) growth remained in line with previous estimates at a fairly healthy 3.0% annualized. Further, US Durable Goods Orders beat estimates and overall recent data out of the US describes a soft landing for the economy that goes against market bets for aggressive monetary easing.
The probability of a 50 bps rate cut at the November Fed meeting has fallen back down to 50% from over 60% prior to the data, according to the CME FedWatch tool.
Gold may also be seeing reduced safe-haven flows as fears the conflict between Israel and Hezbollah might spill over into a ground offensive fail to materialize. Although tensions remain high and a 21-day ceasefire deal put together by the Americans was rejected on Thursday, neither has the situation escalated either.
On Wednesday, the head of Israeli Defence Forces, Herzi Halevi, told his troops that they should prepare for a ground offensive on Lebanon. If such an invasion should take place, it would further ratchet up risk aversion and increase safe-haven flows into the yellow metal.
Technical Analysis: Gold pulls back from new all-time highs
Gold pulls back after hitting yet another all-time high of $2,685 on Thursday.
That said, it is overall still in an uptrend on a short, medium and long-term basis. Since it is a foundational principle of technical analysis that “the trend is your friend,” the odds favor even more upside for the yellow metal.
XAU/USD Daily Chart
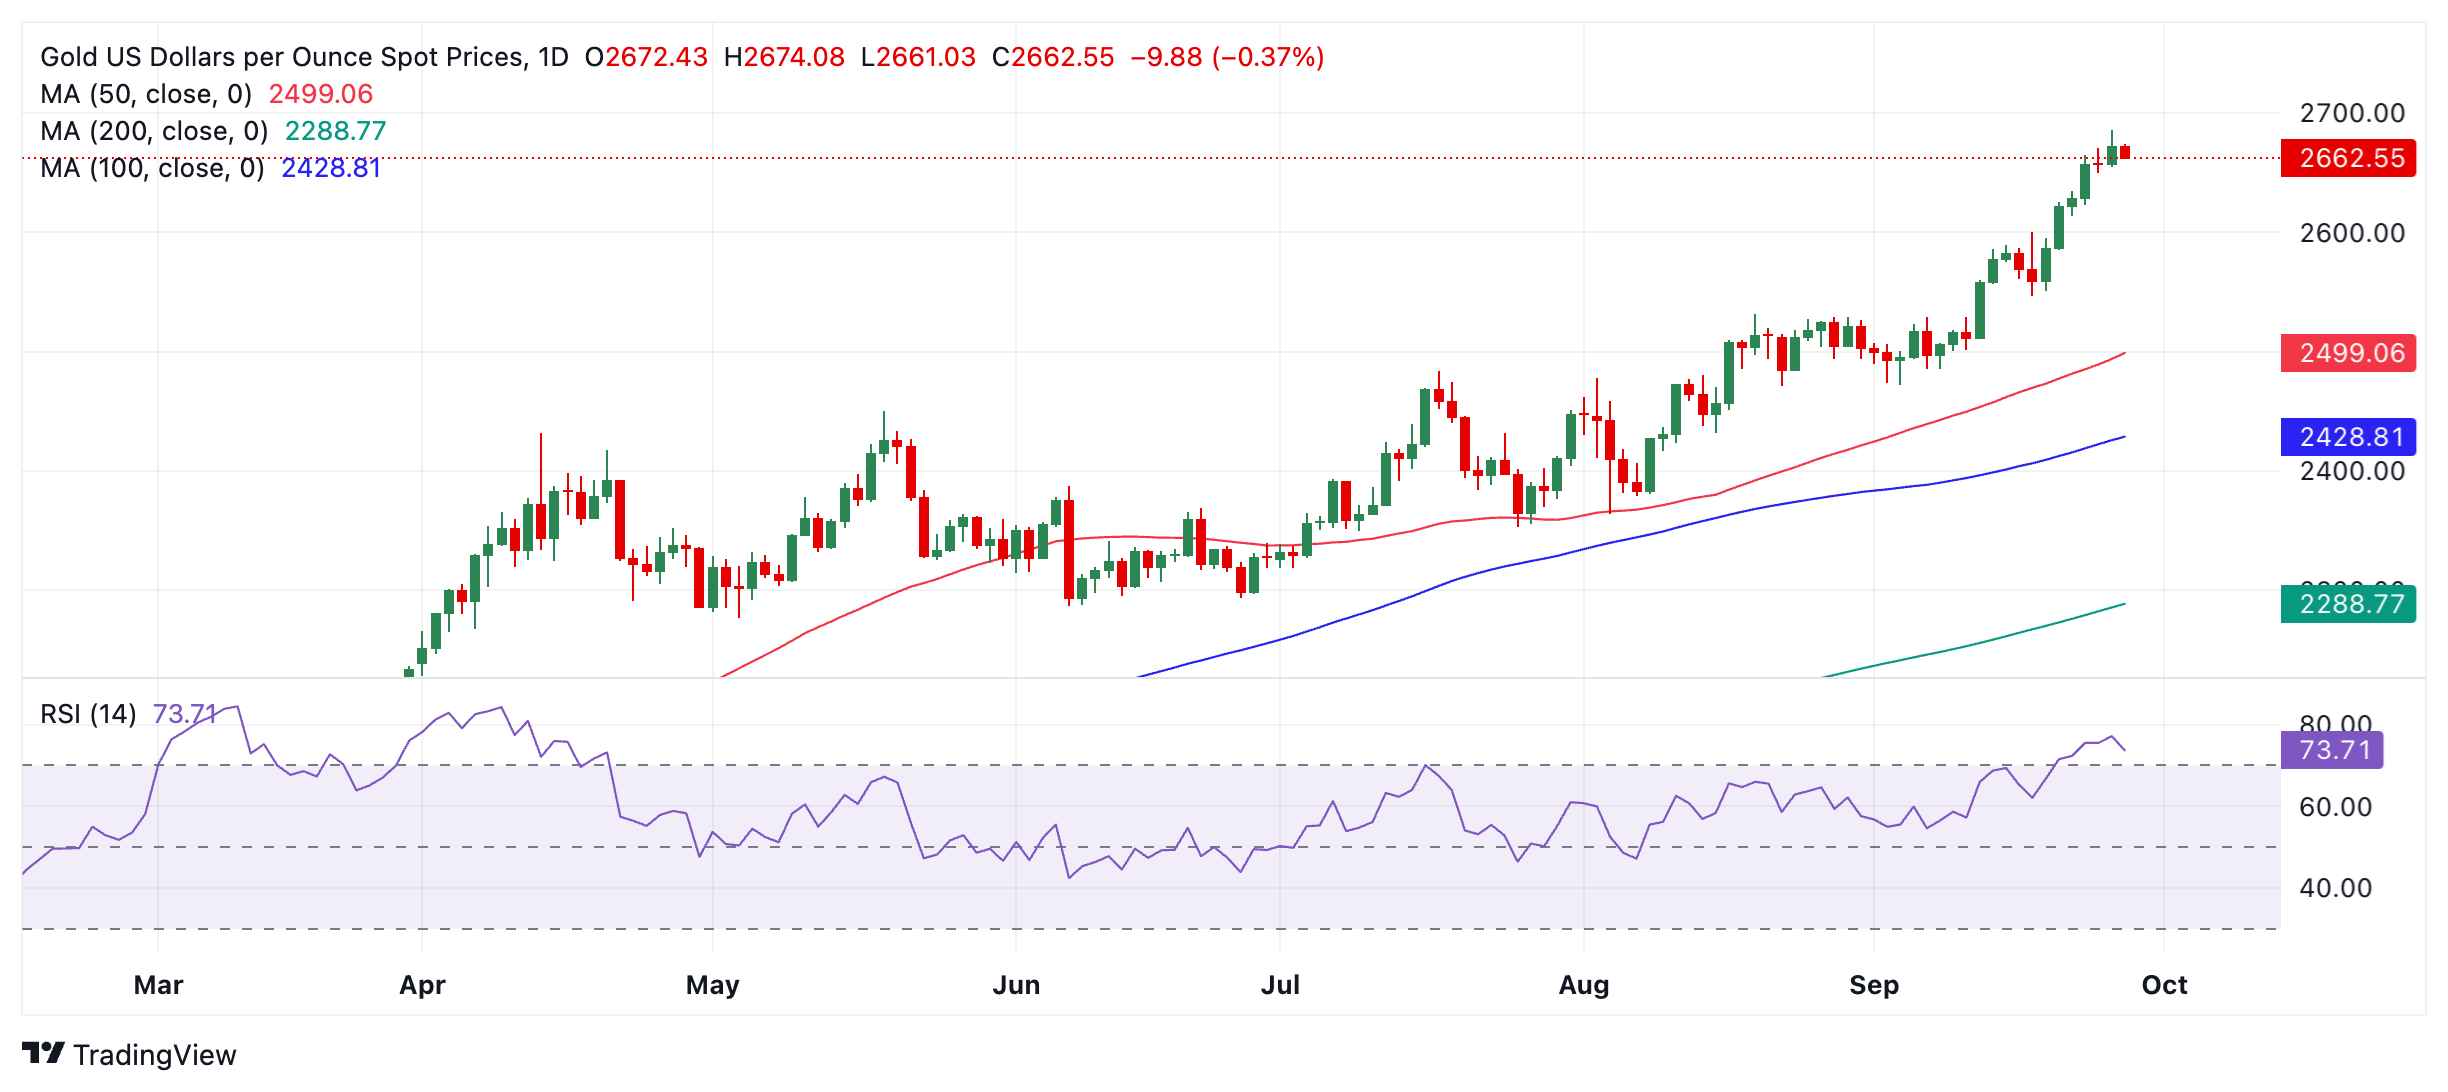
Gold is also now overbought, according to the Relative Strength Index (RSI) momentum indicator, which increases the chances of a deeper pullback evolving. It also advises traders not to add to their long positions. If Gold exits overbought, it will be a sign to close long positions and sell shorts, suggesting an even deeper correction is in the process of unfolding.
That said, RSI can remain overbought for fairly long periods of time in a strongly trending market, and if Gold breaks to higher highs, it will further reconfirm the metal’s uptrending bias. The next targets to the upside are the round numbers $2,700 and then $2,750.
If a correction evolves, firm support lies at $2,600 (September 18 high), $2,550 and $2,544 (0.382 Fibonacci retracement of the September rally).
Gold FAQs
Gold has played a key role in human’s history as it has been widely used as a store of value and medium of exchange. Currently, apart from its shine and usage for jewelry, the precious metal is widely seen as a safe-haven asset, meaning that it is considered a good investment during turbulent times. Gold is also widely seen as a hedge against inflation and against depreciating currencies as it doesn’t rely on any specific issuer or government.
Central banks are the biggest Gold holders. In their aim to support their currencies in turbulent times, central banks tend to diversify their reserves and buy Gold to improve the perceived strength of the economy and the currency. High Gold reserves can be a source of trust for a country’s solvency. Central banks added 1,136 tonnes of Gold worth around $70 billion to their reserves in 2022, according to data from the World Gold Council. This is the highest yearly purchase since records began. Central banks from emerging economies such as China, India and Turkey are quickly increasing their Gold reserves.
Gold has an inverse correlation with the US Dollar and US Treasuries, which are both major reserve and safe-haven assets. When the Dollar depreciates, Gold tends to rise, enabling investors and central banks to diversify their assets in turbulent times. Gold is also inversely correlated with risk assets. A rally in the stock market tends to weaken Gold price, while sell-offs in riskier markets tend to favor the precious metal.
The price can move due to a wide range of factors. Geopolitical instability or fears of a deep recession can quickly make Gold price escalate due to its safe-haven status. As a yield-less asset, Gold tends to rise with lower interest rates, while higher cost of money usually weighs down on the yellow metal. Still, most moves depend on how the US Dollar (USD) behaves as the asset is priced in dollars (XAU/USD). A strong Dollar tends to keep the price of Gold controlled, whereas a weaker Dollar is likely to push Gold prices up.
추천 기사


