

Crude Oil set for weekly loss on waning worries about supply
- Crude Oil edges up slightly after the sharp correction earlier this week.
- Markets are rebalancing after the news that Saudi Arabia is giving up its price target of $100 per barrel and mulls an increase in output.
- The US Dollar Index holds steady ahead of PCE inflation data for August.
Crude Oil is bouncing off a substantial support level on Friday, consolidating the recent losses the commodity had to digest earlier in the week. Still, Oil is set to close the week in the red, weighed by news that Saudi Arabia – the world’s largest crude exporter – is letting loose on its $100 price target and is thinking about increasing production, The downturn seen this week could be seen as an adjustment to the additional supply that will likely be released to markets.
The US Dollar Index (DXY), which tracks the performance of the Greenback against six other currencies, is consolidating ahead of the Personal Consumption Expenditures (PCE) Price Index data. With the release of this index, which is the Federal Reserve’s (Fed) preferred inflation gauge, markets will get another piece of the puzzle to work out how big the November interest-rate cut will be. Expect to see volatility pick up should PCE beats expectations.
At the time of writing, Crude Oil (WTI) trades at $67.40 and Brent Crude at $70.99.
Oil news and market movers: Once risk fades, supply is there
- Oil demand should pick up in Asia after the People’s Bank of China’s (PBoC) decision to lower interest rates and inject liquidity into the banking system. Beijing assembled a last-ditch stimulus assault to pull economic growth back towards this year's roughly 5% target, Bloomberg reports.
- Fuel distributors in Florida are bracing for supply shortages as government officials issued dire warnings about strengthening hurricane Helene, which made landfall in the state on Thursday evening, Reuters reports.
- At 17:00 GMT, the Baker Hughes OIl Rig Count is due to be released. The previous number was at 488, with no forecast available.
- Israel continues this Friday with its bombing of Hezbollah military installations in Lebanon.
Oil Technical Analysis: Under the hood supply remains solid
Crude Oil traders are letting prices bounce on Friday after the sharp price correction unfolded over the past two days. When stripping away the risk premiums that are being priced in on geopolitical developments as in Lebanon or Ukraine, supply is flowing. With more supply from Saudi Arabia set to hit markets, more downturn looks inevitable.
At current levels, $71.46 is back in focus as a first price cap on the upside after a brief false break. If positive momentum continues, a return to $75.27 (the January 12 high) could play out. Along the way towards that level, the 55-day Simple Moving Average (SMA) at $73.83 could ease the rally a bit. Once above $75.27, the first resistance to follow is $76.24, with the 100-day SMA in play.
On the downside, $67.11, a triple bottom in the summer of 2023, should support any downturns and trigger a bounce. Further down, the next level is $64.38, the low from March and May 2023.
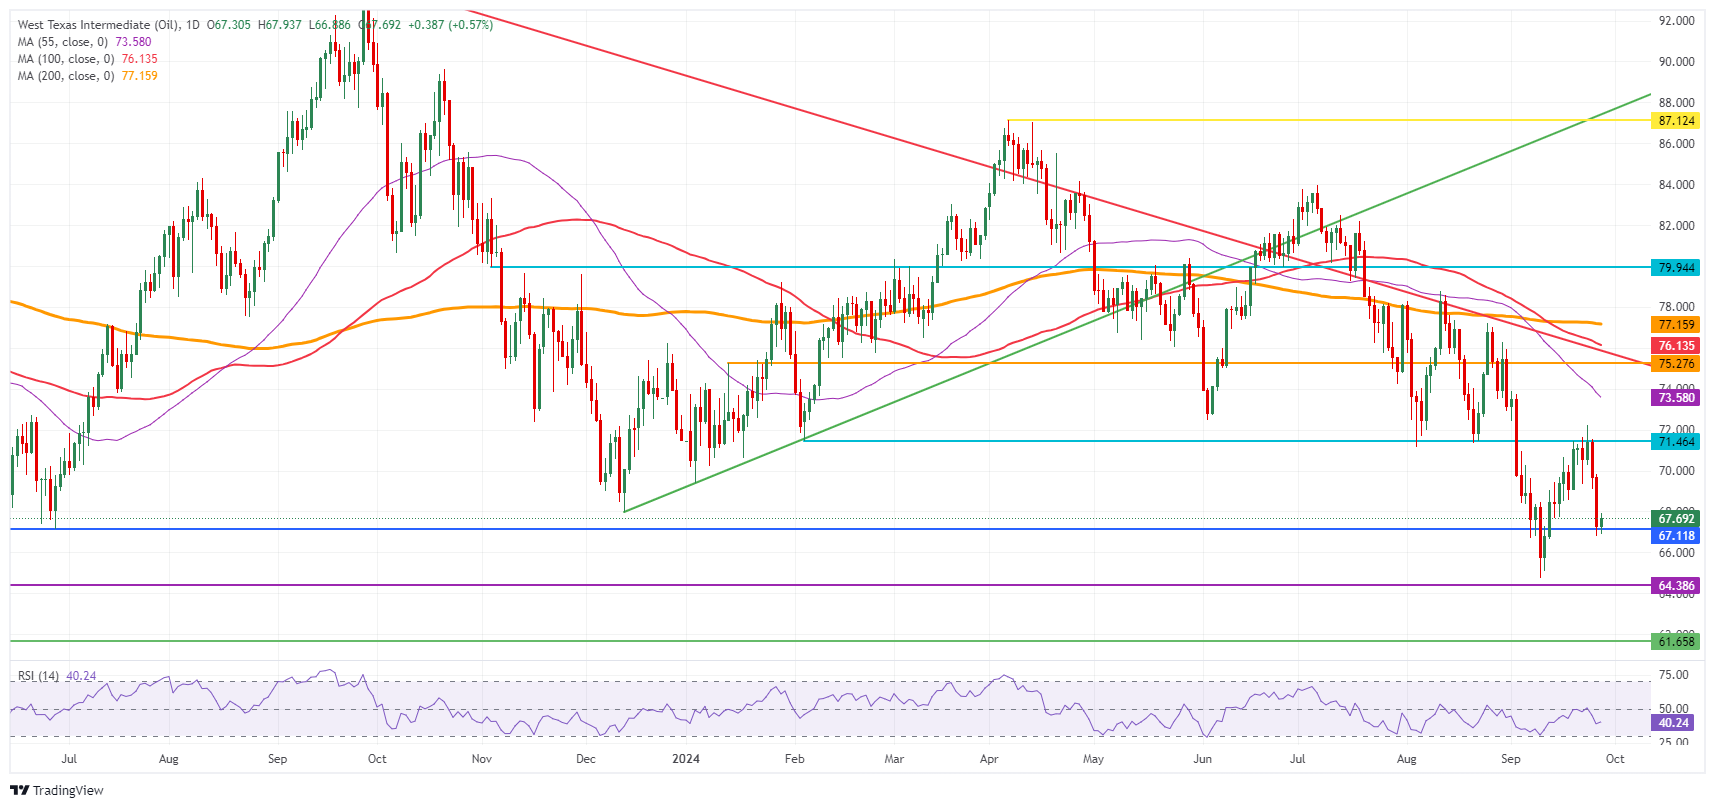
US WTI Crude Oil: Daily Chart
WTI Oil FAQs
WTI Oil is a type of Crude Oil sold on international markets. The WTI stands for West Texas Intermediate, one of three major types including Brent and Dubai Crude. WTI is also referred to as “light” and “sweet” because of its relatively low gravity and sulfur content respectively. It is considered a high quality Oil that is easily refined. It is sourced in the United States and distributed via the Cushing hub, which is considered “The Pipeline Crossroads of the World”. It is a benchmark for the Oil market and WTI price is frequently quoted in the media.
Like all assets, supply and demand are the key drivers of WTI Oil price. As such, global growth can be a driver of increased demand and vice versa for weak global growth. Political instability, wars, and sanctions can disrupt supply and impact prices. The decisions of OPEC, a group of major Oil-producing countries, is another key driver of price. The value of the US Dollar influences the price of WTI Crude Oil, since Oil is predominantly traded in US Dollars, thus a weaker US Dollar can make Oil more affordable and vice versa.
The weekly Oil inventory reports published by the American Petroleum Institute (API) and the Energy Information Agency (EIA) impact the price of WTI Oil. Changes in inventories reflect fluctuating supply and demand. If the data shows a drop in inventories it can indicate increased demand, pushing up Oil price. Higher inventories can reflect increased supply, pushing down prices. API’s report is published every Tuesday and EIA’s the day after. Their results are usually similar, falling within 1% of each other 75% of the time. The EIA data is considered more reliable, since it is a government agency.
OPEC (Organization of the Petroleum Exporting Countries) is a group of 13 Oil-producing nations who collectively decide production quotas for member countries at twice-yearly meetings. Their decisions often impact WTI Oil prices. When OPEC decides to lower quotas, it can tighten supply, pushing up Oil prices. When OPEC increases production, it has the opposite effect. OPEC+ refers to an expanded group that includes ten extra non-OPEC members, the most notable of which is Russia.
추천 기사


