


Natural Gas pops as concerns over tropical storm Francine, Russian supply outweigh downbeat demand outlook
- Natural Gas extends its rally for a fourth straight trading day.
- European Gas reserves are nearly 93% full.
- The US Dollar index eases after a former Federal Reserve member calls for a 50-basis-points interest-rate cut.
Natural Gas is trading near $2.58 on Friday, up for a fourth straight day in a row. The prices rally comes amid increasing concerns around the impact of tropical storm Francine as the US Gas supply might face disruptions due to the closure of several offshore platforms in the Gulf Coast. Also on the supply side, the deteriorating situation between Russia and Ukraine is not helping, with the risk of Russia fully cutting off Europe from its supply.
Meanwhile, the US Dollar Index (DXY), which tracks the Greenback's value against six major currencies, is on the back foot after rallying earlier this week. At one point the US Dollar was rising with markets pricing in only a 25-basis-point interest-rate cut by the US Federal Reserve next week. That was until former Federal Reserve Bank of New York President William Dudley and several articles in top media sites mentioned there is still a possibility for a 50 basis point rate cut next week from the Fed. These led to a seismic shift overnight, with markets now undecided between odds on how big the upcoming rate cut will be.
Natural Gas is trading at $2.58 per MMBtu at the time of writing.
Natural Gas news and market movers: Europe is ready for next winter
- European underground Gas storage level is at 93%, with still some volumes underway and Norwegian Gas flows picking up after a lengthy period of maintenance and outages, Bloomberg reports.
- Egypt has bought another 20 cargoes of Liquified Natural gas (LNG) with an additional premium of $1.2 to $1.5 per mmBtu to European benchmark prices, revealing that Egypt still needs more LNG to get enough electricity, Bloomberg reports.
- US natural gas futures rallied after the weekly storage report showed stockpiles increased by less than what traders initially expected, with the south-central region showing storage still drawing down despite surplus everywhere else. The weekly Energy Information Administration (EIA) on Thursday reported that stockpiles jumped from 13 billion to 40 billion, lower than the 49 billion expected.
Natural Gas Technical Analysis: Concerns back to the forefront
Natural Gas prices are rallying, but there are increasing concerns about demand as Europe reserves look robust ahead of the upcoming heating season. This happens as traders were hoping that Thursday’s number from the EIA would have shown an addition of 49 billion cubic meters of Gas to US reserves. Instead, the number came up 9 billion cubic meters short, fueling concerns that this could mean issues ahead for the upcoming winter in the US at a moment when tropical storm Francine has disrupted Gas production in the Gulf.
On the upside, that blue ascending trend line could act as a keep short-term, near $2.62. Should the Gas price make its way above it, a longer term uptrend could play out here. Further up, $2.80 and $2.86 (red descending trend line) are coming into play.
On the downside, three clear levels can be identified to provide near-term and longer- term support in case prices correct to the downside. First up is the 100-day Simple Moving Average (SMA) at $2.46. A leg lower, both the 200-day SMA and the 55-day SMA are around $2.28, just ahead of $2.13.
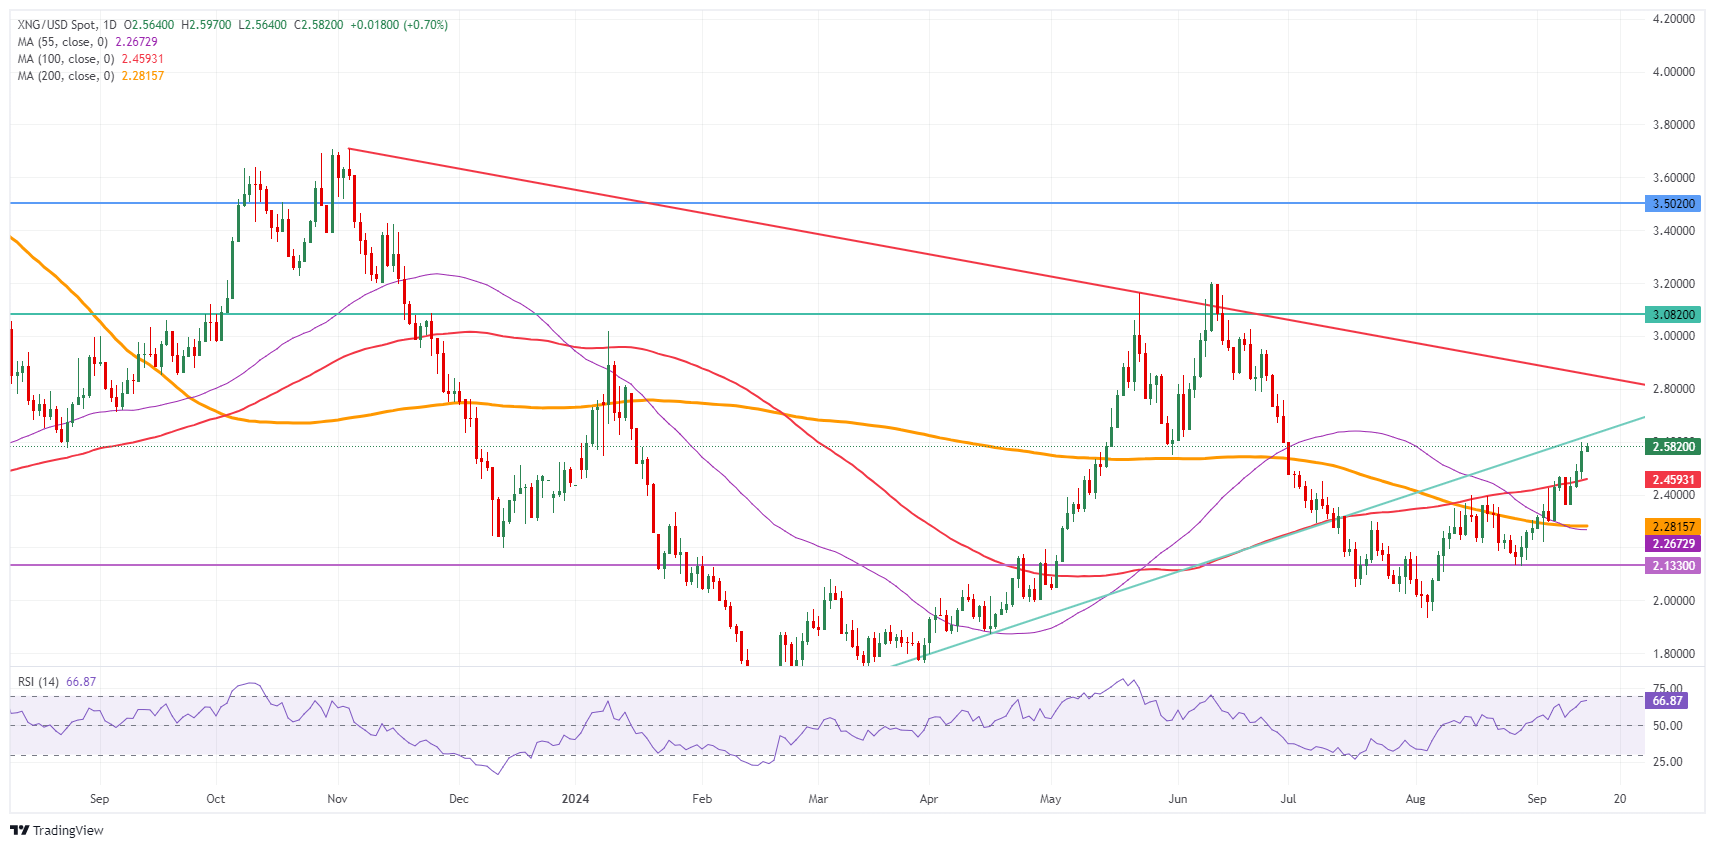
Natural Gas: Daily Chart
Natural Gas FAQs
Supply and demand dynamics are a key factor influencing Natural Gas prices, and are themselves influenced by global economic growth, industrial activity, population growth, production levels, and inventories. The weather impacts Natural Gas prices because more Gas is used during cold winters and hot summers for heating and cooling. Competition from other energy sources impacts prices as consumers may switch to cheaper sources. Geopolitical events are factors as exemplified by the war in Ukraine. Government policies relating to extraction, transportation, and environmental issues also impact prices.
The main economic release influencing Natural Gas prices is the weekly inventory bulletin from the Energy Information Administration (EIA), a US government agency that produces US gas market data. The EIA Gas bulletin usually comes out on Thursday at 14:30 GMT, a day after the EIA publishes its weekly Oil bulletin. Economic data from large consumers of Natural Gas can impact supply and demand, the largest of which include China, Germany and Japan. Natural Gas is primarily priced and traded in US Dollars, thus economic releases impacting the US Dollar are also factors.
The US Dollar is the world’s reserve currency and most commodities, including Natural Gas are priced and traded on international markets in US Dollars. As such, the value of the US Dollar is a factor in the price of Natural Gas, because if the Dollar strengthens it means less Dollars are required to buy the same volume of Gas (the price falls), and vice versa if USD strengthens.
추천 기사


