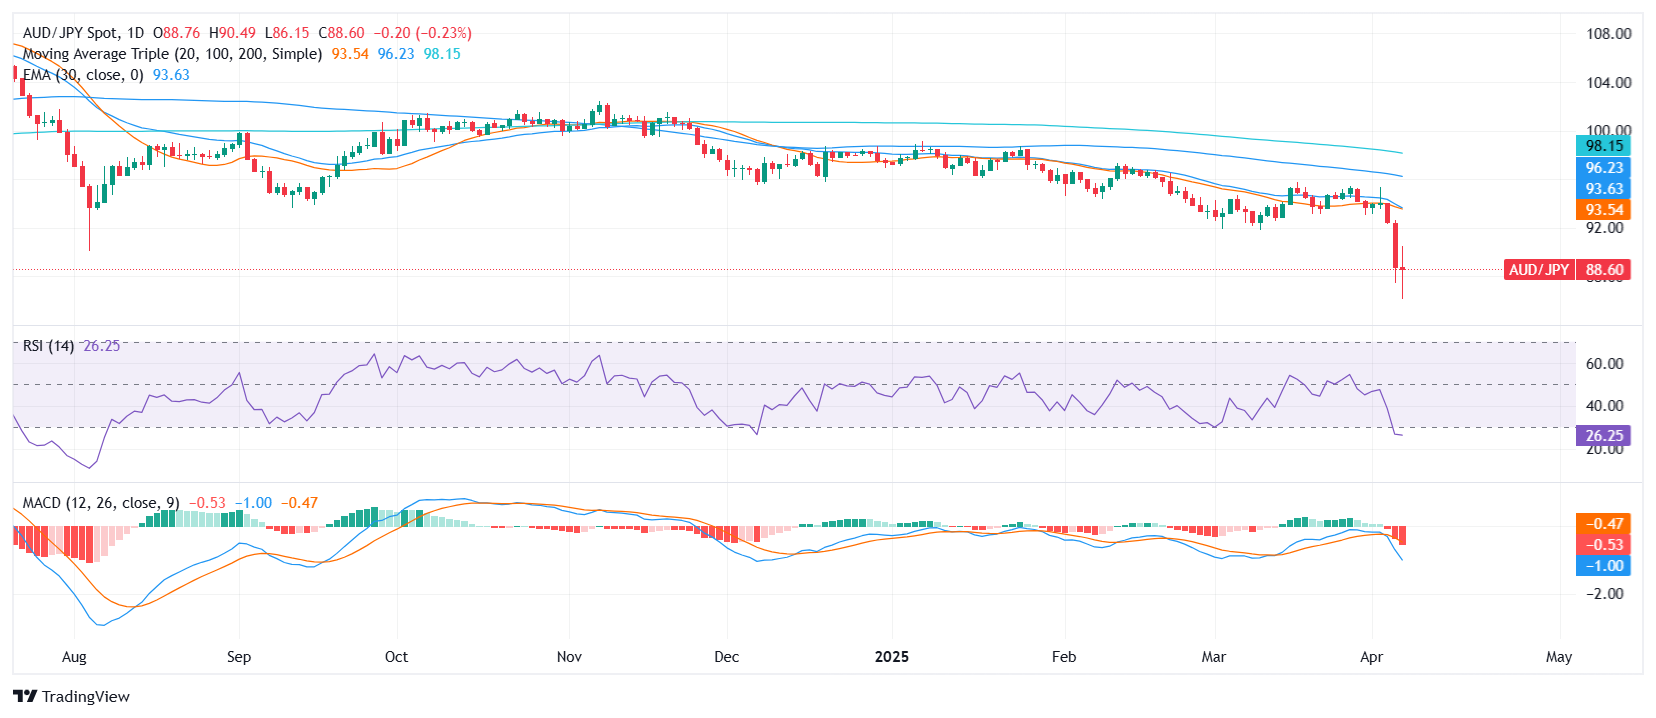
AUD/JPY Price Analysis: Aussie dips toward 88.50 as bearish momentum persists
- AUD/JPY traded near the 88.50 zone on Monday, drifting lower with modest downside momentum.
- Technical indicators point to a broadly bearish structure, with price still well below key moving averages.
- Resistance looms at 89.57 and beyond, while bearish momentum is reinforced by negative MACD and momentum readings.
The AUD/JPY pair extended its soft tone on Monday ahead of the Asian session, easing toward the 88.50 area. Despite a mild daily decline, the pair remains entrenched in a broader downtrend, trading well beneath its key moving averages. While intraday volatility was contained, the technical backdrop reflects persistent bearish pressure.
Daily chart

Momentum indicators remain tilted to the downside. The Moving Average Convergence Divergence (MACD) issues a sell signal. The Relative Strength Index (RSI) stands at 25.57, suggesting neutrality but nearing oversold territory. Although the Commodity Channel Index (CCI) at -309.10 may imply potential buy conditions, the broader trend is clearly bearish.
Moving averages reinforce this view. The 20-day Simple Moving Average (SMA) at 93.546, the 100-day at 96.303, and the 200-day at 98.266 all slope downward, signaling sustained selling pressure. The shorter-term 10-day Exponential Moving Average (EMA) and 10-day SMA, both sitting above 92.00, also point lower, further capping upside attempts.
Key resistance is located at 89.578, followed by 90.944 and the 10-day EMA near 92.169. To the downside, further support may develop closer to the lower boundary of the recent range near 86.13, should the selling extend. While oversold signals may trigger a pause, the path of least resistance remains to the downside.

