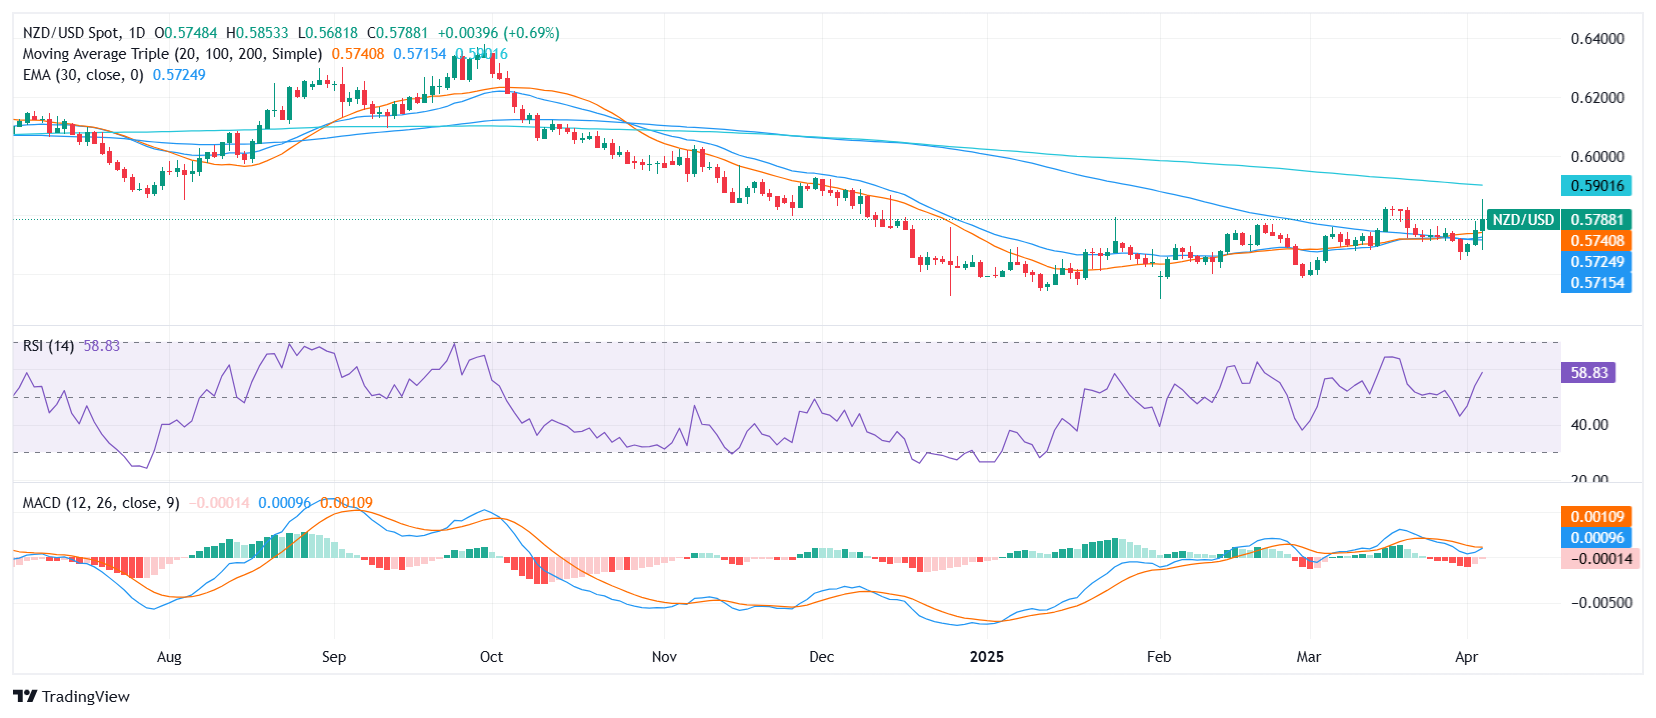
NZD/USD Price Analysis: Kiwi extends advance near 0.5800 with bullish technical signals intact
- NZD/USD trades near the 0.5800 zone on Thursday, extending gains ahead of the Asian session.
- Momentum remains positive with MACD showing a buy signal, while RSI and other oscillators hold in neutral territory.
- Support rests at 0.5776 and 0.5749, while 0.5850 and the 200-day SMA cap upside potential.
The NZD/USD pair continued its positive run on Thursday, holding firm near the 0.5800 area and gaining momentum ahead of the Asian session. Price action remains contained within the upper section of the daily range, signaling steady demand even as short-term momentum indicators remain mixed. Overall, the pair is supported by key short-term averages that lean in favor of further upside.
Daily chart

From a technical perspective, the outlook leans bullish. The Moving Average Convergence Divergence (MACD) continues to flash a buy signal, while the Relative Strength Index (RSI) at 59.87 remains neutral but tilted higher. Other oscillators such as the Williams Percent Range (WPR) at -27.16 and the Average Directional Index (ADX) at 12.35 also reflect a neutral tone, indicating a lack of extreme conditions in momentum.
Key short-term moving averages, including the 10-day Exponential Moving Average (EMA) at 0.57495, 10-day Simple Moving Average (SMA) at 0.57362, and the 20-day SMA at 0.57449, all suggest upside support. The 100-day SMA at 0.57199 reinforces the positive bias. On the flip side, the longer-term 200-day SMA at 0.59049 stands as a key resistance level, alongside the 0.58517 zone, which could limit bullish continuation in the near term.
Support is seen at 0.57766, followed by 0.57629 and 0.57495. These levels could cushion any pullbacks should momentum stall. Overall, while the pair remains buoyant, further gains may depend on a break above the 200-day SMA, which would strengthen the bullish case further.

